Figure 7.
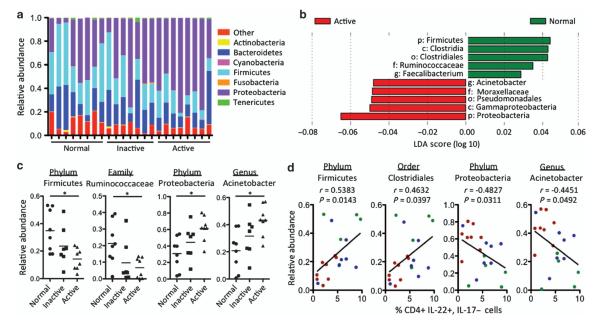
Correlations of the mucosal microbiota communities with inflammation status in patients with ulcerative colitis. (a) Relative abundance of the taxonomic groups for biopsy samples from each tissue type. The eight most abundant phyla over all samples are presented. (b) Histogram of linear discriminant analysis (LDA) scores computed for features differentially abundant between normal and actively inflamed tissues. Features with LDA scores <0.02 are presented, and taxonomic level is indicated by p (phylum), c (class), o (order), f (family), and g (genus). (c) Relative abundance of specific phyla and genera in a and b that were differentially abundant in different tissue types. Each point represents a biopsy sample, and mean is indicated with a horizontal line. The effect of tissue on abundance was determined using a Kruskal–Wallis test (Firmicutes, P = 0.045; Faecalibacterium, P = 0.042; Proteobacteria, P = 0.014; Acinetobacter, P = 0.015). Differences between individual tissues were determined using Dunn’s Multiple Comparison Test, and significant differences (P<0.05) are indicated with an asterisk. (d) A Spearman’s correlation was performed between the relative abundance of Firmicutes, Clostridiales, Proteobacteria, and Acinetobacter and the percentage of CD4+ interleukin (IL)-22+, IL-17− cells. These correlations were all significant (P<0.05) with P values and r values shown on graphs. Green = normal; blue = inactive; red = active.

