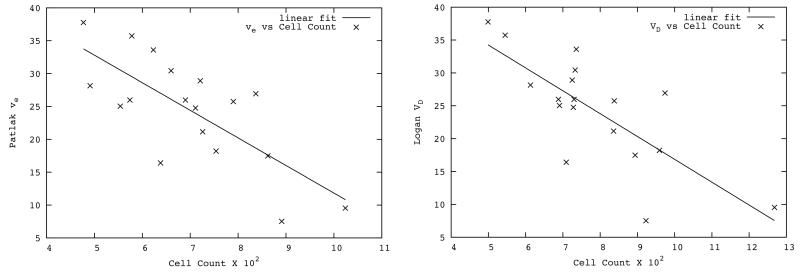
Figure 5.
Left: Scatter plot of Patlak plot estimates of interstitial volume versus tumor cellularity in the Histo sub-region. The solid line shows the linear fitting of the plot (r = 0.75, p < 0.001). Right: Scatter plot of Logan plot estimates of distribution volume (VD) versus tumor cellularity measured in the Histo sub-region. Solid line shows the linear fitting of the plot (r = 0.76, p < 0.001).

