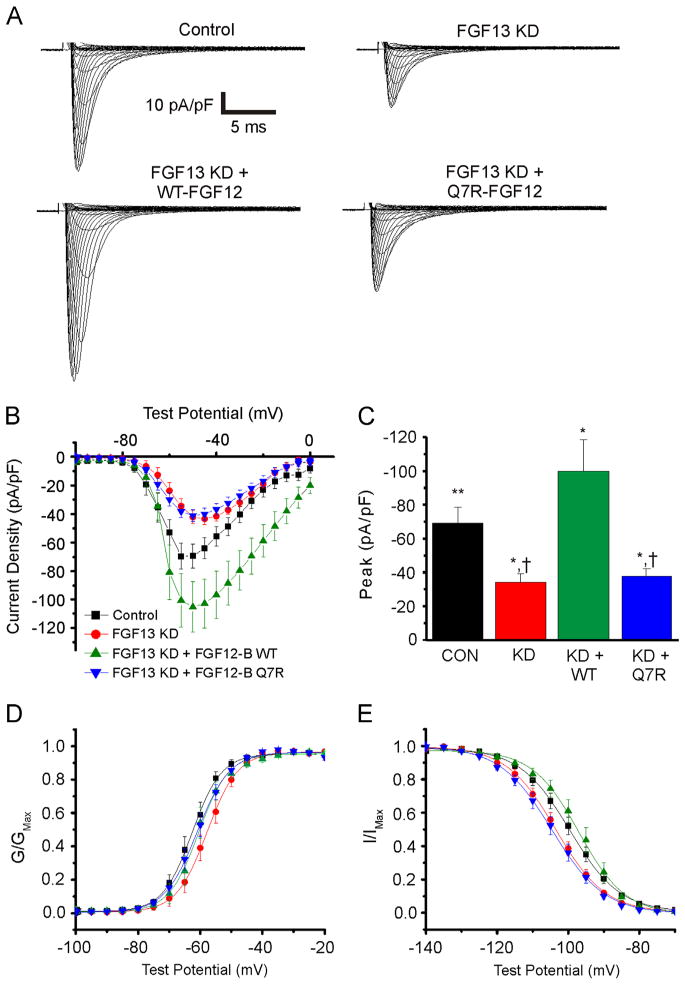
Figure 5.
Q7R-FGF12 cannot rescue reduced NaV1.5 current density and availability from FGF13 KD while WT can. A: Representative Na+ current traces for the 4 groups tested. B and C: I–V curve and summarized peak current data. D: Activation curve. E: Steady-state inactivation curve. *P < .05 versus control; **P < .05 versus WT-FGF12B; †P < .01 versus WT-FGF12B. FGF = fibroblast growth factor; KD = knocked down; WT = wild type.

