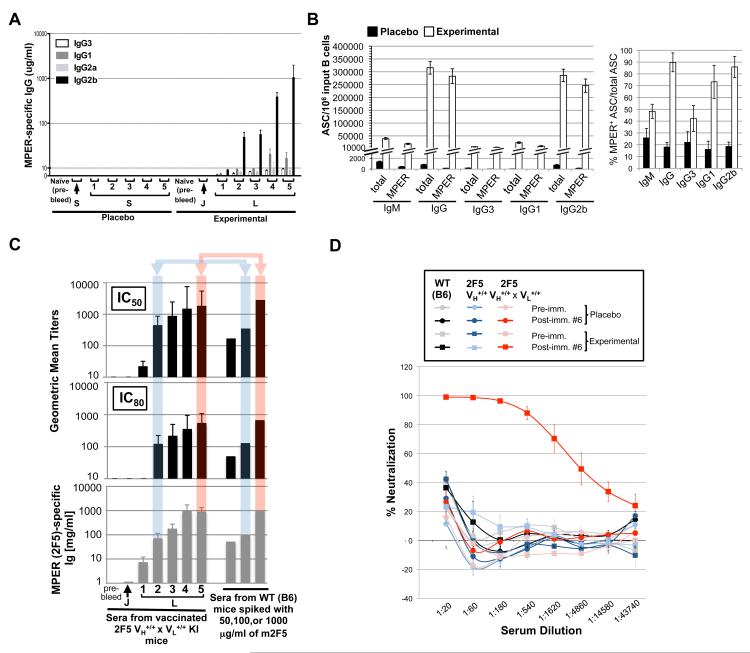
Figure 2. Specificity of MPER antibody responses in immunized 2F5 complete KI mice.
A. MPER (2F5 epitope)-specific serum IgG subclass levels in 2F5 complete KI mice from placebo (saline-injected) or experimental (JRFL primed, TLR agonist-MPER peptide-liposome conjugate boosted) immunization groups, calculated as described in Materials and Methods. B. Total or MPER-specific IgM and IgG subclass splenic ASC responses in immunization 2F5 complete KI groups. Shown is ELISPOT data calculated from dilution curve platings (as shown in Fig. S2A), from two independent experiments, each with ≥3 mice/group, graphically represented either as total ASCs for each isotype (left) or as MPER+ B-cells, normalized as frequency of all ASCs (right). C. Kinetics and potency of serum neutralizing antibody induction in vaccinated 2F5 complete KI mice. Top panels: GMTs of reciprocal dilutions of sera to inhibit HIV-1 B.MN.3 at 50 or 80% levels in the TZM-b/l neutralization assay (12,31), Bottom panel: corresponding MPER (2F5)-specific Ig levels from individual mice required. To demonstrate neutralization potency, GMTs of sera from WT mice spiked with 50,100, or 1000 μg/ml of m2F5 are also shown, with shaded boxes comparing control vs. vaccinated sera GMTs at similar MPER-specific Ig concentrations. Data are from two immunization studies, each with sera from ≥3 individual mice/time point assayed. D. Relative HIV-1 neutralization activity of serum Igs elicited by placebo or experimentally vaccinated WT, 2F5 VH+/+ KI, and 2F5 complete KI strains. Neutralization curves of serum were taken from vaccinated WT, 2F5 VH+/+ KI, and 2F5 complete KI groups (≥three mice/group) at peak MPER+ serum Ig induction (immunized 6 times), using the HIV-1 B.MN.3 isolate in the TZM-b/l neutralization assay.

