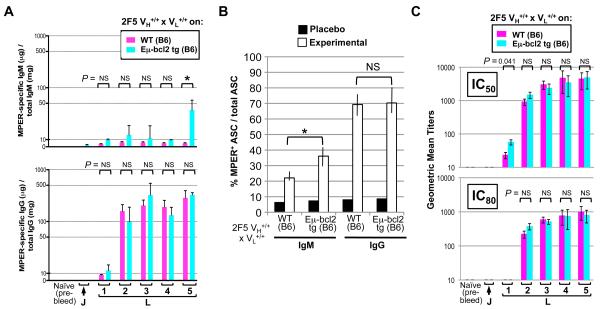
Figure 3. Effect of constitutively increasing B cell survival on quantity/quality of MPER-specific serum Ab and splenic B-cell responses elicited by immunization in 2F5 complete KI mice.
A. ELISA measurements of normalized MPER-specific serum IgM and IgG Ab responses from 2F5 complete or 2F5 complete KI × Eμ-bcl2 tg mice, immunized with placebo or experimental regimens. B. ELISPOT analysis revealing total or MPER-specific IgM and IgG ASC responses in 2F5 complete KI groups on either WT (B6) or Eμ-bcl2 tg (B6) backgrounds (either placebo or experimentally immunized). Shown is graphical representation of ELISPOT data calculated from dilution curve platings (as shown in Fig. S2B), from ≥3 mice/group for two independent experiments, with MPER-specific B cells normalized as frequency of all ASCs. In all instances, significance values were determined using a two-tailed Student's test. *P ≤ 0.05, NS = Not Significant. C. Kinetics of serum neutralizing Ab induction in vaccinated 2F5 complete KI mice on WT (B6) or Eμ-bcl2 tg (B6) backgrounds. Shown are GMTs (Geometric Mean Titers) of reciprocal dilutions of sera to inhibit B.MN.3 at 50 or 80% levels in the TZM-b/l assay. Significance values were determined using a two-tailed Student's test. NS = Not Significant. Note the modestly elevated GMTs of IC50 neutralization in 2F5 complete KI × Eμ-bcl2 tg mice after the first boost, potentially reflective of the higher combined levels of MPER+ serum IgG+IgM observed at this early time point seen in Fig. 3A.

