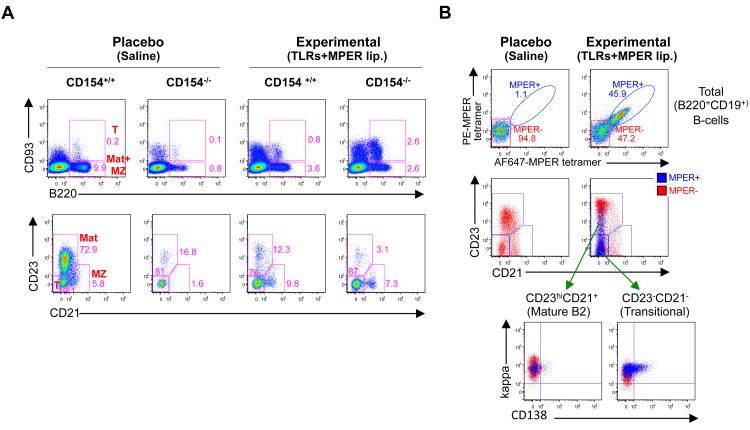
Figure 5. Distribution and gp41 MPER epitope specificity of splenic B-cells in immunized 2F5 complete KI mice.
A. FACS dot plot histograms (representative of two experiments) comparing the distribution of splenic B-cell subsets in 2F5 complete KI immunization groups (on either CD154−/− or CD154+/+ backgrounds), vaccinated with placebo (saline-injected) or experimental (JRFL primed, TLR agonist-MPER peptide-liposome conjugate boosted) regimens. Splenocytes were analyzed by flow cytometry 4d after 6th immunizations, either by sub-fractioning singlet, live lymphocytes with CD93 and B220-specific mAbs (upper panels), or fractioning total (CD19+B220+) B-cell subsets within singlet, live, lymphocyte-gated populations using CD21 and CD23-specific mAbs (lower panels). Numbers indicate percentages of B-cells in each gate, and B-cell subsets denoted in red lettering in top left panel are defined as: T=transitional (B220+CD93+), Mat+MZ (B220+CD93−), whereas those in the lower left panel are defined as: T=newly formed i.e., transitional (CD21−CD23−), MZ=marginal zone (CD23intCD21hi), and Mat=mature B2 (CD23hiCD21int). B. FACS dot plot histograms (representative of two experiments) of surface Ig reactivity to the 2F5 neutralization epitope. Top panels: live, singlet, lymphocyte-gated total (B220+CD19+) B-cells from placebo or experimentally-immunized 2F5 complete KI mice, as determined by flow cytometric bivariate fractionation using MPER epitope-specific tetramers (12,30) labeled with AF647 and PE. Lower panels: splenic B-cell subset distributions of MPER tetramer+ and MPER tetramer− subsets (denoted in blue and red dots, respectively), back-gated into mature B2, transitional, and short-lived plasmacyte B-cell subsets.

