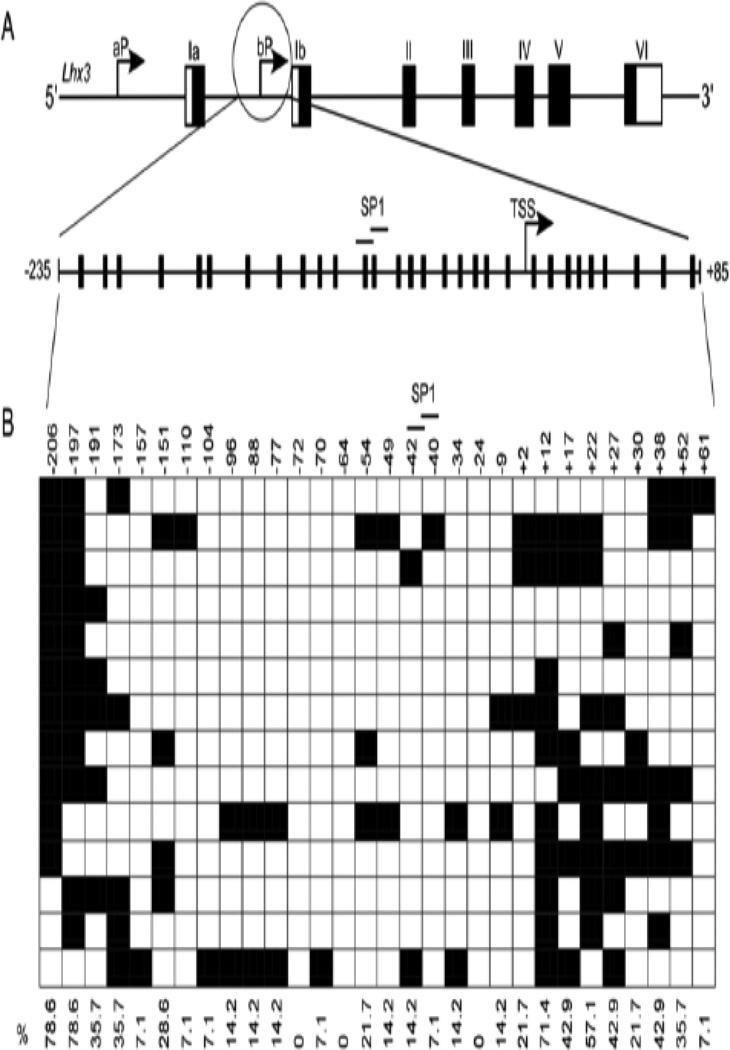
Figure 3. Lhx3b promoter and its methylation pattern.
(A) The upper diagram represents the mouse Lhx3 gene, with black rectangles signifying protein-coding exons and white areas denoting untranslated exonic regions. Two upstream promoters (aP and bP) produce the Lhx3a and Lhx3b mRNAs. The diagram below shows sites of potential methylation in the Lhx3b promoter, spanning from position −235 to +85 with the transcription start site (TSS) set at position 0. The positions of SP1 binding sites are shown. (B) The methylation pattern of the Lhx3b promoter in mouse pituitary Pit-1/0 cells was determined by bisulfite sequencing (materials and methods). Black boxes indicate methylated CpGs and open boxes indicate non methylated CpGs.

