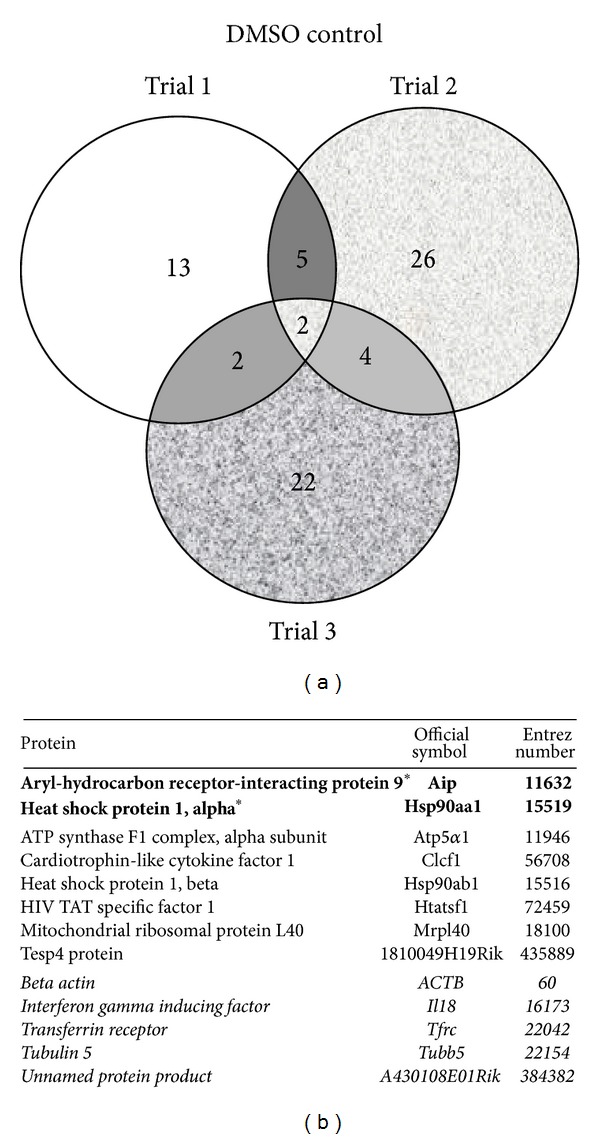
Figure 2.

DMSO control data set. (a) Venn diagram of proteins identified by mass spectrometry in 3 data sets of AHR-TAP DMSO (0.01%) control. (b) Table listing of proteins identified in two out of three data sets. Bold type with * denotes a protein represented in all three data sets. Italicized type denotes nonspecific proteins identified in both AHR-TAP and GFP-TAP samples.
