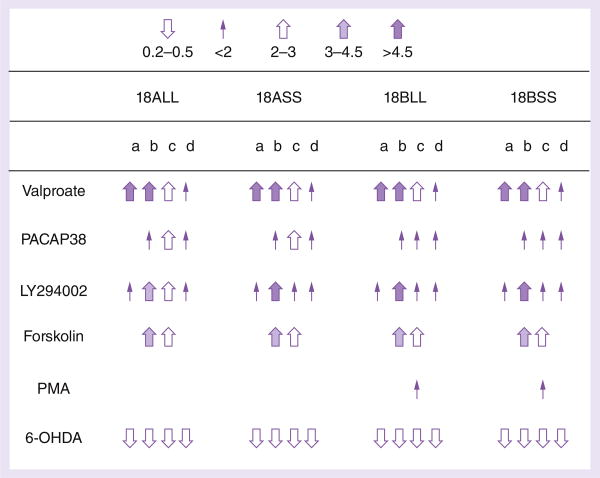
Figure 3. Regulation of hDAT promoter activity by 6-OHDA, PACAP38, valproate, LY294002, forskolin and PMA in four cell lines, based on Luc activity analysis.
All arrows represent statistical significances by one-way ANOVA Tukey (n = 4–8), compared with solvent controls; no arrow, no statistical significance.
a: SK-N-AS (1.8%)†; b: BE(2)-M17 (2.9%); c: IMR-32 (6.2%);
d: SH-SY5Y (0.5%).
†Average residual activity of the vector as a percentage of 18ALL activity.

