
Figure 4.
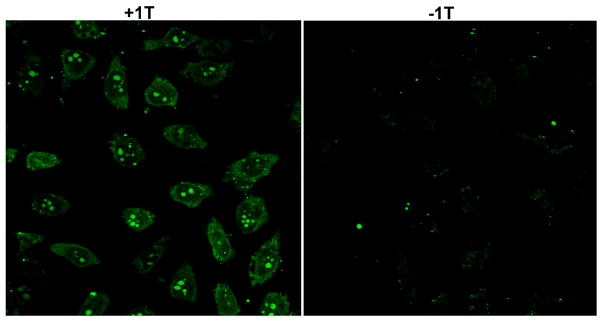
Fluorescence microscopy images show subcellular distribution of A10, which is labeled with fluorescein dye (green). (Left) 500 μM 1T and 1 μM FAM-A10 incubated with HeLa cells for 24 h. (Right) 1 μM FAM-A10 incubated with HeLa cells for 24 h.