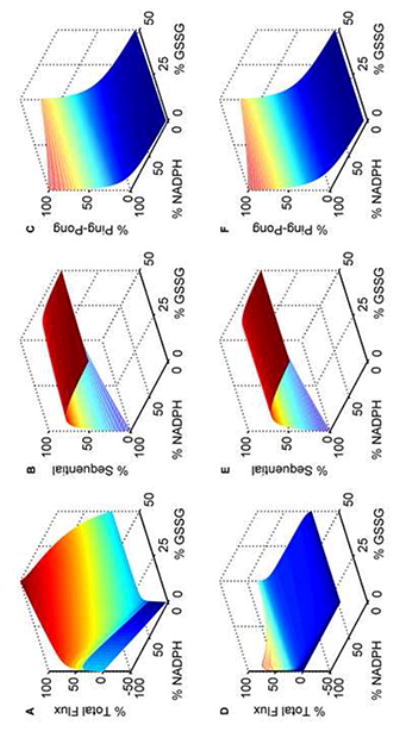
Figure 8.

Model simulations of GR kinetics for in vivo-like conditions. The GSH and NADPH pools are set to 10 mM and 0.1 mM, respectively. The % GSSG is calculated as the ratio of its concentration to the total GSH pool concentration (Gtot), which is defined as Gtot = GSH + 2×GSSG. Percentage fluxes of GR with both varying NADPH and GSSG at optimal pH 7.5: (A) total flux, (B) sequential flux, and (C) ping-pong flux. At acidic pH 6.0: (D) total flux, (E) sequential flux, and (F) ping-pong flux. The model was simulated using estimated parameters from Montero et al. [30]. All the total flux values were obtained by dividing with the maximum flux value in the absence of products. Ping-pong and sequential fluxes were calculated as the fraction of the total flux for the respective substrate concentrations.
