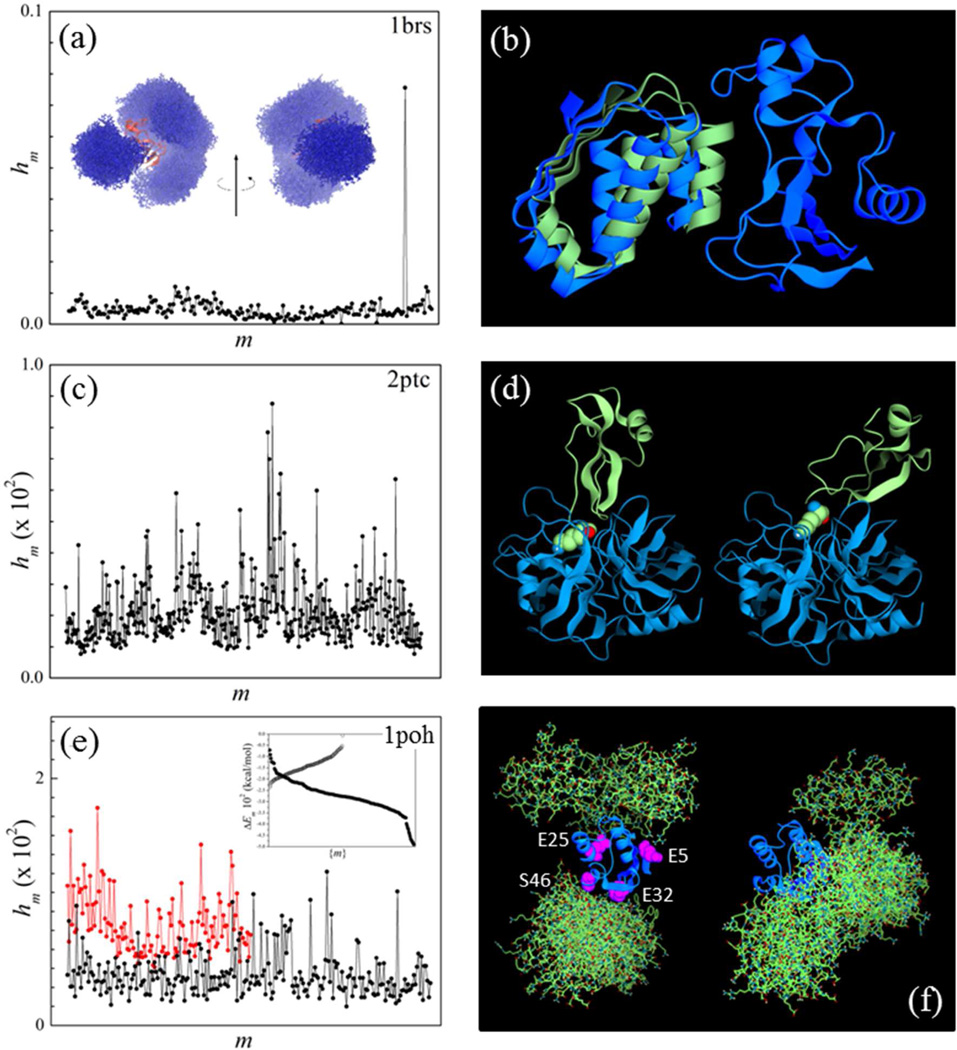
Figure 5.
(a) Probability distribution of prescreened modes of the barnase/barstar complex calculated from Eq. (17) with λ = 25. The mode m’ with the highest weight hm’ is near-native. Inset: prescreened modes of barstar (atom representation; blue) and barnase (ribbon; red) obtained upon optimization of the electrostatic norm e [Eq. (7)]. These putative electrostatic-driven first-contact modes determine the biasing function for the self-adaptive conformational bias MC sampling. (b): Mode m’ (blue) and crystal structure (green) of barnase bound to barstar. (c) Same as in (a) for 2ptc. (d) Trypsin/inhibitor complex (2ptc): crystal structure (left) and prescreened mode m’ with the smallest Cα-rmsd with respect to the crystal structure (right); m’ has the fifth highest weight in (c); K15 of the inhibitor protein is shown (purple). (e): Same as in (a) 1poh (black); probability distribution obtained upon optimization of the hydrophobic norm h [Eq. (8)] is also shown (red). Inset: energy of pre-screened modes (polar: solid circles; non-polar: open circles); (f) Histidine-containing phosphocarrier protein HPr (1poh): conformations of the ten highest hm modes obtained upon optimization of e (electrostatic modes; left) and h (hydrophobic modes; right) superimposed to a central HPr protein; amino acids used as labels in a recent NMR study of ultra-weak self-association are shown.

