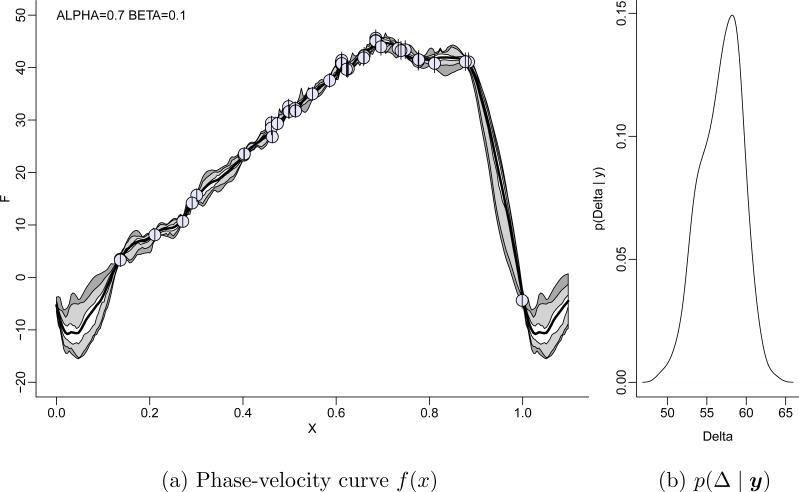
Figure 5.
Phase-velocity curve f(x) for T Monocerotis. Panel (a) shows the posterior estimated phase-velocity curve E(f | y) (thick central line), and pointwise central HPD 50% (light grey) and 95% (dark grey) intervals for f(x). The circles shows the data points. Inference is under a BNP model p(f) using a basis expansion of f with wavelets. Panel (b) shows posterior inference on the range Δ = max(f) – min(f).

