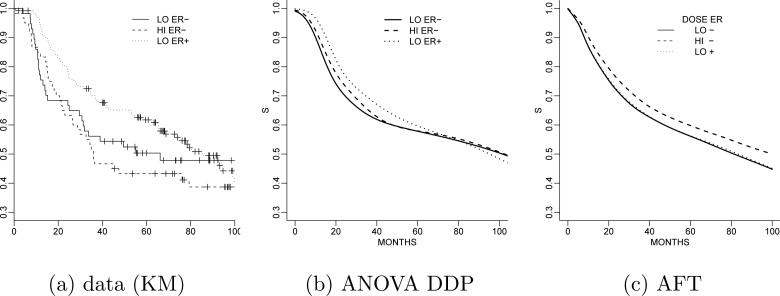
Figure 6.
Cancer clinical trial. Panel (a) shows the data as a Kaplan-Meier (KM) plot arranged by dose and ER status. Posterior survivor functions under the ANOVA DDP model (panel b) and alternatively under the AFT median regression model (panel c). In both plots, the solid line refers to low treatment dose and negative ER status. The dashed line corresponds to high treatment dose and negative ER status, while the long dashed line shows the survival for a patient in the low dose group but with positive ER status.

