Figure 2.
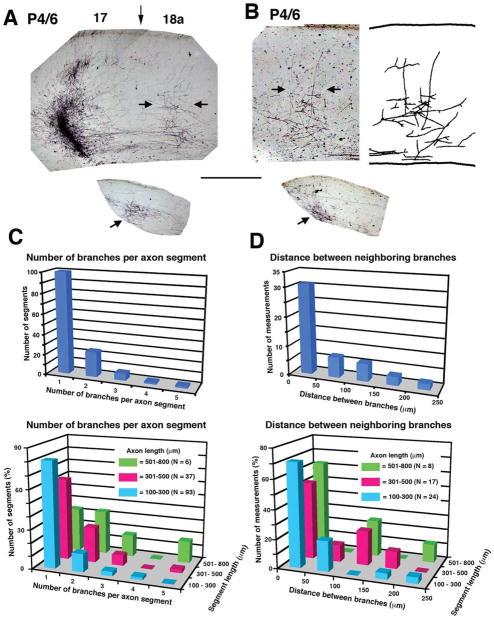
Area 17–18a projections at P6. A, B: Images from coronal tissue sections from two animals illustrating the area 17–18a projections labeled following discrete intracortical injections of the anterogradely transported tracer BDA into area 17. Medial is to the left. Both animals (case L47 BN in A and case L47 FN in B) were injected with BDA at P4 and studied at P6 (P4/6). Darkly stained field to the left in A corresponds to the tracer injection, and the vertical arrow indicates approximate location of 17/18a border. The injection site is not shown in B. Labeled fibers in area 18a accumulate in column-like fields in regions indicated by the horizontal arrows. The drawing to the right in B is a reconstruction of the labeled field from two neighboring sections. Lower insets show restricted BDA-labeled fields (indicated by arrows) in the dLGN ipsilateral to the injection sites. C: Top histogram illustrates the distribution of parental axon segments with one or more collateral branches independent of the length of the parental axon segment analyzed. Bottom histogram illustrates the distribution of parental axon segments with one or more collateral branches as a function of the length (coded by different colors) of the parental axon segment analyzed. D: Top histogram illustrates the distribution of distances between neighboring branches observed in parental axon segments with more than one branch, independent of the length of the axon segment analyzed. Bottom histogram illustrates the distribution of distances between neighboring branches in parental axon segments with more than one branch as a function of the length (coded by different colors) of the axon segment analyzed. Scale bar = 500 μm.

