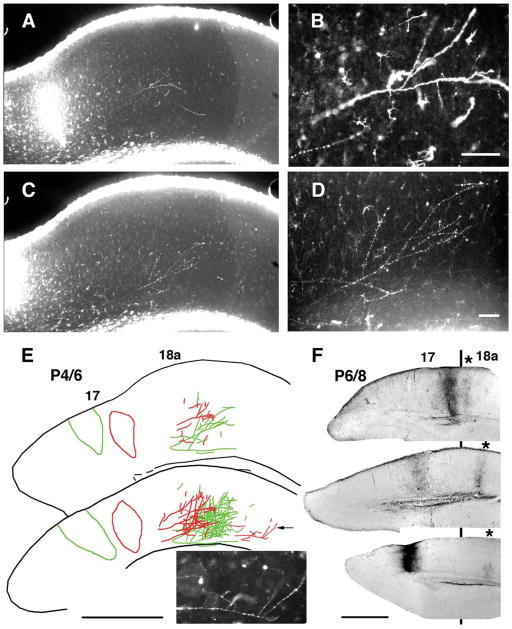
Figure 4.
Topography of striate-extrastriate projection in young rats analyzed in coronal tissue sections. Medial is to the left. A–E: Topography revealed at P6 following paired injections of two different dextran Alexa fluorescent tracers into area 17 at P4. Injections were separated by 350 μm in the mediolateral direction. A, C: Low-power images illustrate tracer injection and the resulting projections in area 18a observed in the same tissue section with AlexaFluor 594 (A) and AlexaFluor 488 (C). Magnified views of fibers in area 18a labeled with each tracer are shown in B and D, respectively. A drawing of data from both tracers observed in this single section is shown in the upper panel in E, and a reconstruction of the data in this section and in two additional neighboring sections is shown in the bottom panel in E. Inset shows magnified view of parental axon (indicated by arrow in drawing) giving rise to several, closely spaced interstitial branches located in a more lateral field, probably area LL (Montero et al., 1973; Olavarria et al., 1984). F: Topography of striate-extrastriate projection in animals injected with BDA at P6 and studied at P8. Coronal sections from three animals show injection of BDA into area 17 and resulting labeled field in area 18a (marked with asterisk). Black line indicates approximate location of 17/18a border. The projections illustrated are probably to presumptive extrastriate area LM (Olavarria and Montero, 1981). Data show mirror-image topography of 17 to 18a projections: as the injection site is displaced medially in area 17, the projection field in area 18a is displaced laterally (Olavarria and Montero, 1981). Scale bars = 100 μm in B, D; 1.00 mm in E, F.

