Figure 6.
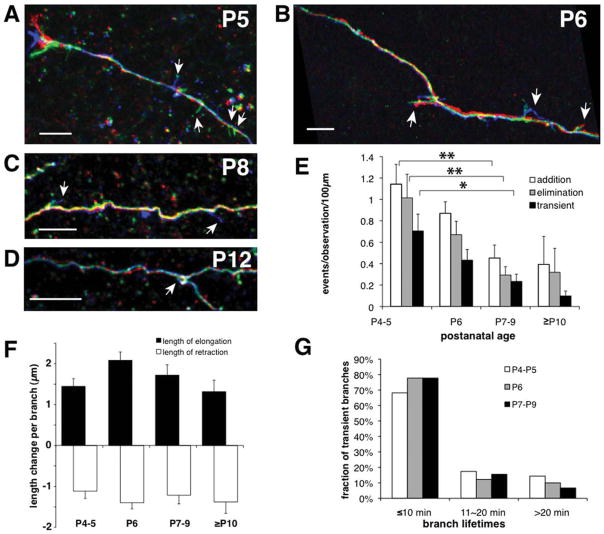
Frequency of dynamic behaviors, but not growth rates or branch lifetimes, declines with age. A–D: Colorized temporal overlays show dynamic behaviors of interstitial filopodia at P5 (A), P6 (B), P8 (C), and P12 (D). Red, green, and blue correspond to early, middle, and late time points. Arrows indicate dynamic filopodia. E: Rates of branch addition and elimination as well as transient branches all decrease with age (N = 18 axons at P4–5, 30 axons at P6, 23 axons at P7–9, 5 axons at P10–12; *P < 0.05, **P < 0.01 ANOVA with Bonferroni posttest). F: Mean change in length of each dynamic filopodium per imaging interval (usually 10 minutes) was the same at all ages (elongating: N = 336, 268, 208, and 12; retracting: N = 324, 296, 228, and 12, respectively, for P4–5, P6, P7–9, and P10–12). G: Distribution of lifetimes of transient interstitial filopodia was the same at all ages, with the majority of transient branches present only during one image (N = 143, 91, and 41 at P4–5, P6, and P7–9). There were too few transient filopodia (N = 3) in the P10–12 group to generate a meaningful plot. Scale bars = 10 μm.

