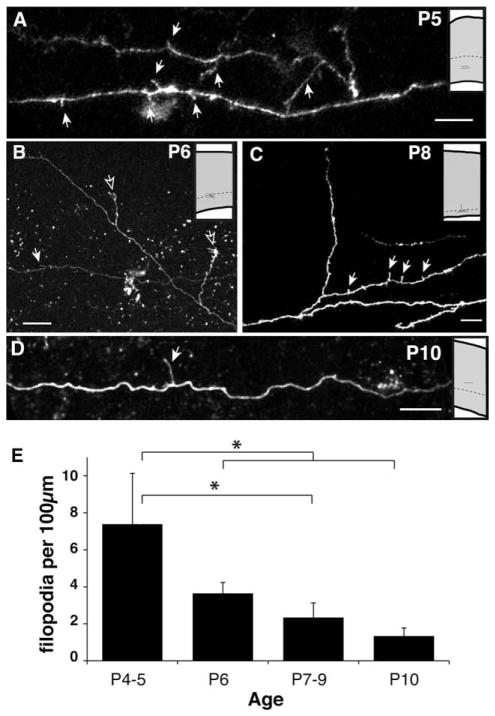
Figure 8.
Axonal filopodia in the white matter become less prevalent with age. A–D: Examples of white matter or deep layer 6 axons imaged in acute living slices at different ages. Insets show relative locations where images were collected. The presumptive white matter boundary is indicated by a dashed line. This border is found, respectively, at 700 μm, 800 μm, 900 μm, and 1,000 μm in P5, P6, P8, and P10 rat visual cortex (Kageyama and Robertson, 1993). Solid arrows highlight filopodia; open arrows indicate branches entering the cortical gray matter. E: Density of filopodia observed decreases with age. *P < 0.05 ANOVA with Bonferroni posttest. Scale bars = 10 μm.

