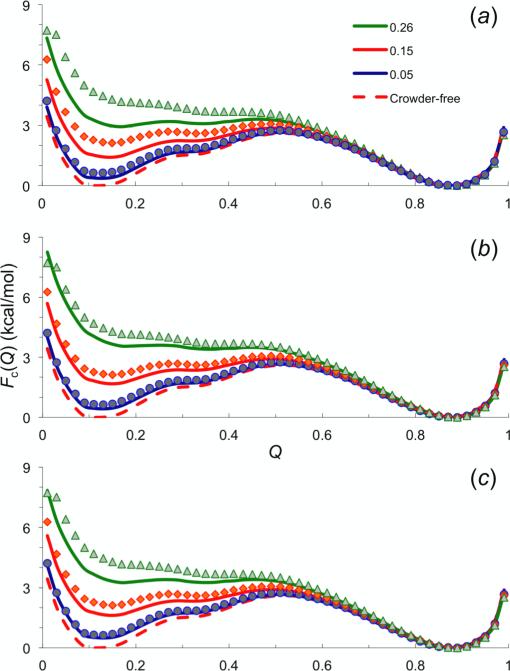
Figure 2.
Comparison of Fc(Q) results from MB's direct simulations and predicted by the postprocessing approach. Circles, diamonds, and triangles show the simulation results for protein G in the presence of 8 Å crowders at ϕ0 = 0.05, 0.15, and 0.26, respectively. The dashed curve shows the free energy function in the absence of crowders; the three solid curves show Fc(Q) for the three ϕ0 values by postprocessing the crowder-free simulations. The temperature is 310 K. The postprocessing results are obtained by either (a) assuming ϕ0 as the actual crowder volume fraction ϕ; or correcting for the finite size of each simulation system, through (b) carving out the region in and around the real test protein inaccessible to a crowder in calculating ϕ or (c) treating the insertion of a fictitious test protein into the crowders around the real test protein as insertion into the mixture of the real test protein and the crowders.

