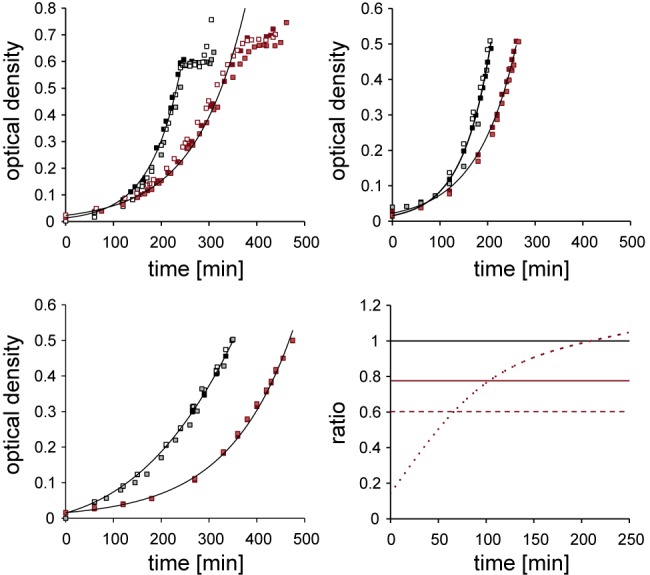
FIG 1 .

Growth curves of E. coli NCM3722 (black) and NCM3722ΔglnG (red) strains under different nitrogen regimes. Samples for targeted quantitative determination of metabolites, transcripts, and proteins in vivo were from these cultures during exponential growth in ammonium-rich conditions (top left), in glutamine (top right), or 10 min after growth arrest, indicating nitrogen-starved conditions (bottom left). Growth rates for ammonium-starved conditions (Table 1) were derived from logarithmic growth before nitrogen run out. Bottom right, growth rate differences (ΔOD600/Δt) between NCM3722 and NCM3722ΔglnG strains under different regimes: ammonium rich (long dash), glutamine (short dash), ammonium starved (solid).
