
FIG 2 .
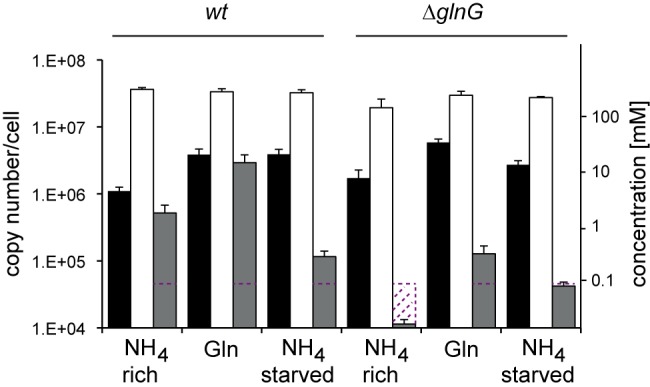
Intracellular concentrations (molecules/cell) of α-ketoglutarate (black), glutamine (white), and glutamine (gray) under different nitrogen regimes as indicated. Note logarithmic scale on the y axes. Red dotted line indicates quantification limit. Error bars indicate one standard error of the mean across minimally three biological replicates.