
FIG 1 .
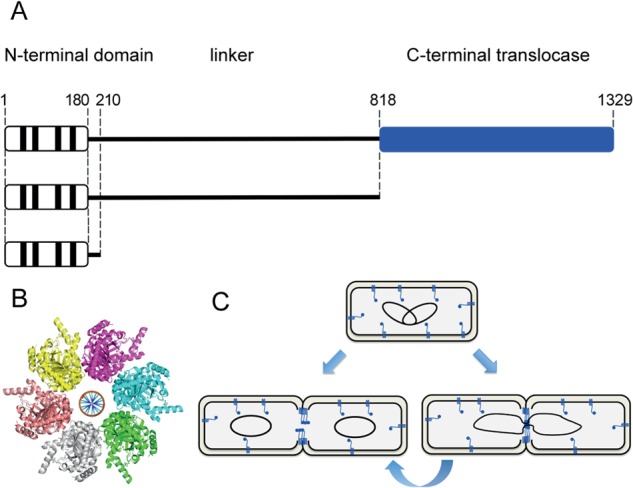
Schematic representation of FtsK and its localization during cell division. (A) Diagrams representing the E. coli FtsK protein. The top diagram depicts the wild-type protein, while the bottom diagrams represent the different deletion mutants analyzed in this work. Numbers indicate the positions of amino acid residues. Vertical black bars represent transmembrane segments contained in the N-terminal domain. The C-terminal translocase domain is represented in blue. (B) Crystal structure of hexameric Pseudomonas aeruginosa FtsKCΔγ containing modeled DNA (31). (C) Schematic of FtsK localization throughout the cell cycle in the absence and presence of chromosome dimers (left and right diagrams, respectively). In a growing cell (top row), inner-membrane-associated FtsK is distributed throughout the cell. In dividing cells (second row), FtsK is recruited to divisomes in all cells, independently of the presence of chromosome dimers. Until this work, the number of cellular FtsK molecules and their oligomeric state as a function of cell cycle have not been known.