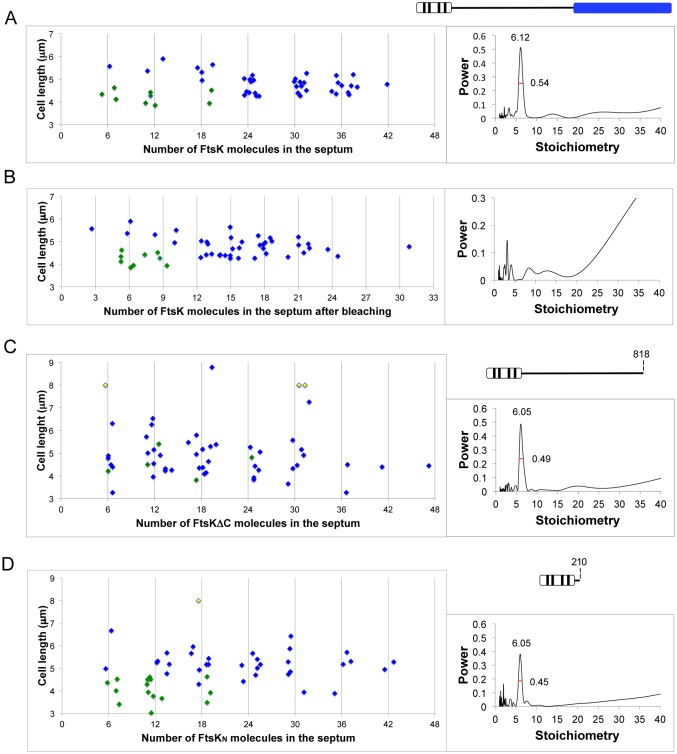
FIG 2 .
Stoichiometry of FtsK at midcell. (A, C, and D) Stoichiometry of YPet derivatives of midcell FtsK (A), FtsKΔC (C), and FtsKN (D). (B) Fluorophore stoichiometry after ~50% of the fluorophores had been bleached. Green symbols represent unconstricted cells, blue symbols represent constricted cells, and yellow symbols represent filaments whose length exceeds 9 µm. Plots on the right show the periodicity derived from power spectra of the data displayed in the adjacent graphs, with the peak width at half-maximal height also shown. Schematics of wild-type and mutated variants of FtsK are shown above the graphs.

