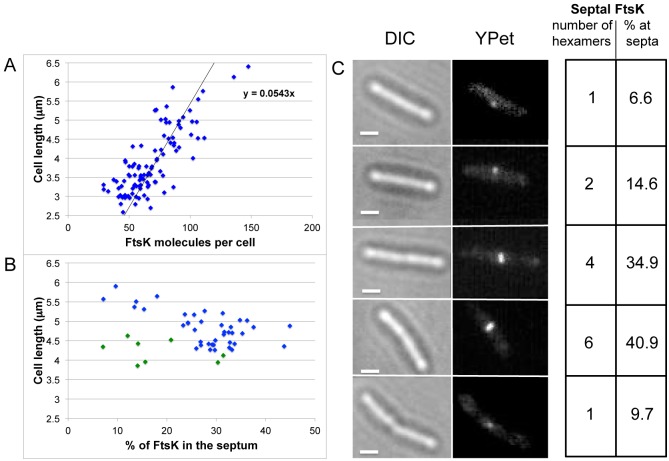
FIG 4 .
Numbers of FtsK molecules in cells. (A) Numbers of FtsK-YPet molecules as a function of cell length in a mixed population of dividing and nondividing cells. (B) Percentage of FtsK-YPet molecules that were localized at midcell in cells with a central FtsK-YPet signal as a function of cell length. Green symbols represent unconstricted cells. (C) Representative images of cells containing FtsK-YPet derivatives at different stages of the growth cycle. Differential interference contrast (DIC) and fluorescent images are displayed, and the number of FtsK hexamers, the cell length, and the percentage of molecules present at midcell are shown.

