Figure 3.

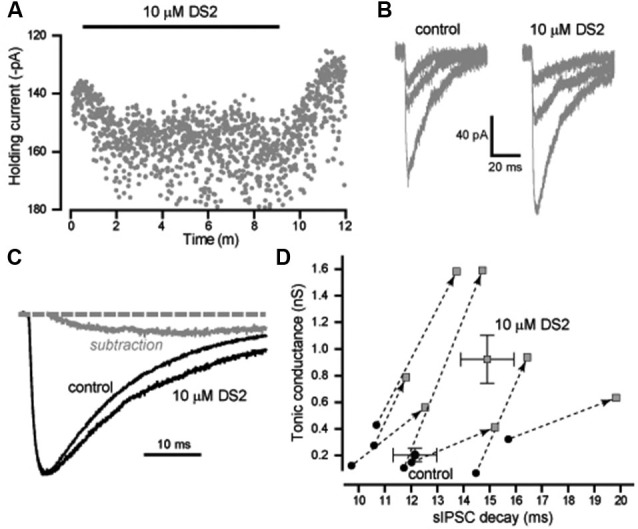
DS2 enhances the tonic conductance and also prolongs the IPSC decay in layer II/III pyramidal neocortical neurons. (A) Plot of the average holding current (VH −70 mV) calculated every 1 s from consecutive 100 ms epochs (grey circles). The application of 10μM DS2 is indicated by the solid black bar. (B) Representative IPSCs detected in control conditions and during DS2 application. (C) Average synaptic waveform constructed from control data and in the presence of DS2. A simple subtraction of these traces has been performed to illustrate the slow rising and slow decaying DS2-sensitive component of the IPSC (grey line). The dashed line indicates the normalised baseline. (D) Scatter plot of the tonic conductance against the IPSC decay for each cell (grey circles) before and after DS2 application (joined by dashed line and arrow). Superimposed on this plot are the average values across all cells (mean ± SEM, n = 7).
