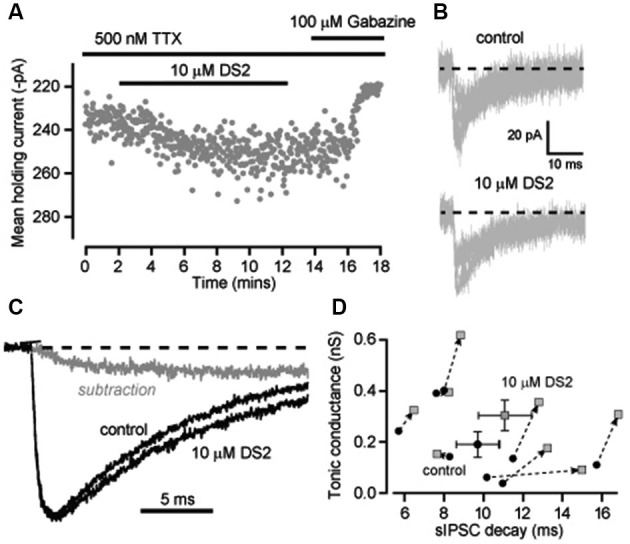
Figure 4.

Enhancement of the tonic conductance by DS2 in layer II/III cortical neurons is attenuated in conditions of reduced GABA release whilst still significantly increasing the IPSC decay. (A) Plot of the average holding current calculated every 1 s from consecutive 100 ms epochs (grey circles) recorded from a cortical neuron during a 10 μM DS2 application followed by application of 100 μM gabazine in the continuous presence of the sodium channel blocker TTX (500 nM). (B) Representative mIPSCs recorded in control conditions and after DS2 application from a single cell. Dashed line indicates the normalised baseline. (C) Representative trace of average IPSCs recorded in the presence of TTX before and after DS2 application and the subtracted waveform (grey line). Dashed line indicates the normalized baseline. (D) Scatter plot of the average tonic conductance and the IPSC decay before and after DS2 application (dotted arrow) for each cell examined (grey circles) and also the average data for all cells (mean ± SEM, n = 8).
