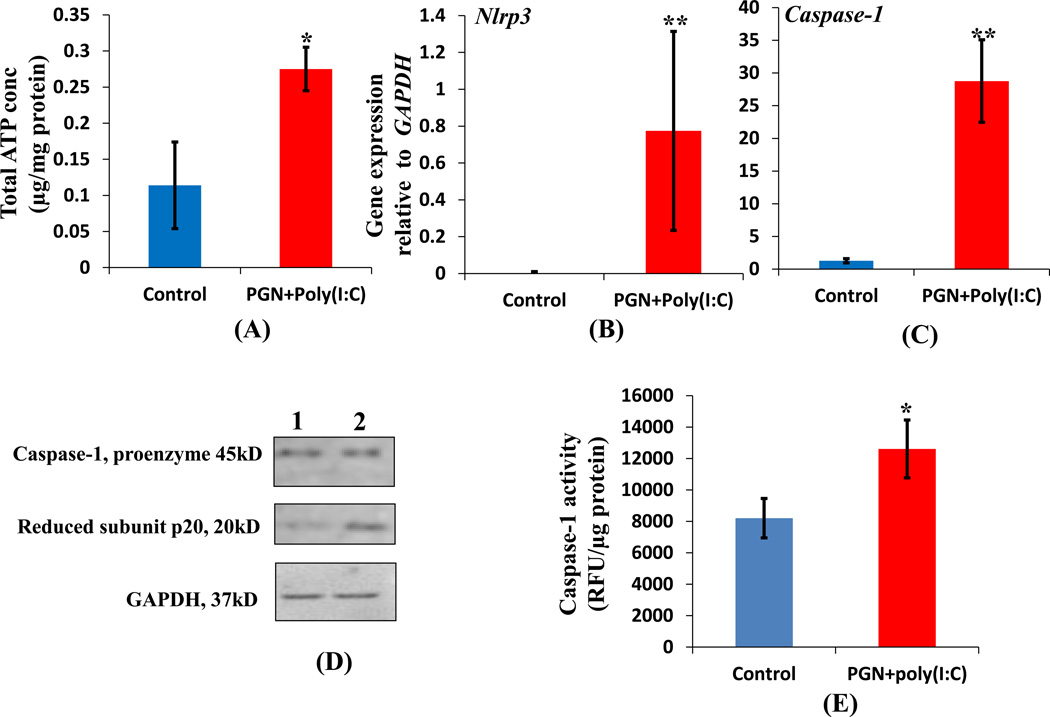
Figure 11. PGN+poly(I:C) induces inflammasome activation in uterus.
Total ATP concentration (A); expression of Nlrp3 (B); Caspase-1 (C) in control and PGN+poly(I:C) treated uterus. N=6–11 each group. Panel D shows the level of activated caspase-1 in (lane 1) control and (lane 2) PGN+poly(I:C) treated uterus. Panel E show the caspase-1 activity. N=4–6 each group. Error bars=±SEM. *P≤0.05, **P≤0.01 Significant difference vs respective control.

