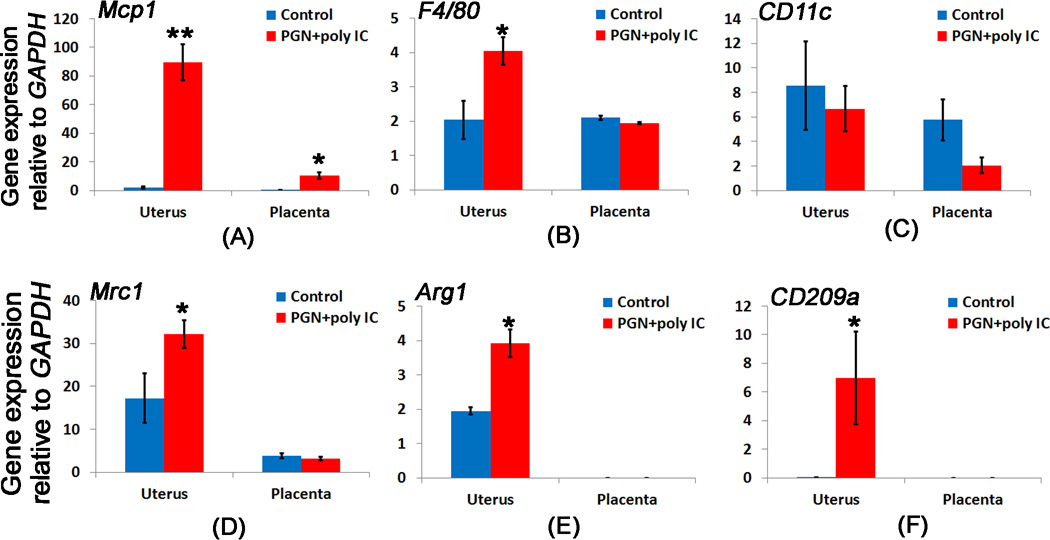
Figure 7. M2 like macrophage markers are increased in the PGN+poly(I:C) treated uterus.
The bar diagram showing the mRNA expression of (A) Mcp1 and, macrophage marker (B) F4/80, M1 macrophage marker (C) CD11c, M2 macrophage markers (D) Mrc1, (E) Arg1, and (F) CD209a in the uterus and placenta recovered from control and PGN+poly(I:C) treated groups. N=6 for control and n=11 for PGN+poly(I:C) treated group. Error bars= ±SEM. *P≤0.05, **P≤0.01 Significant difference vs respective control.

