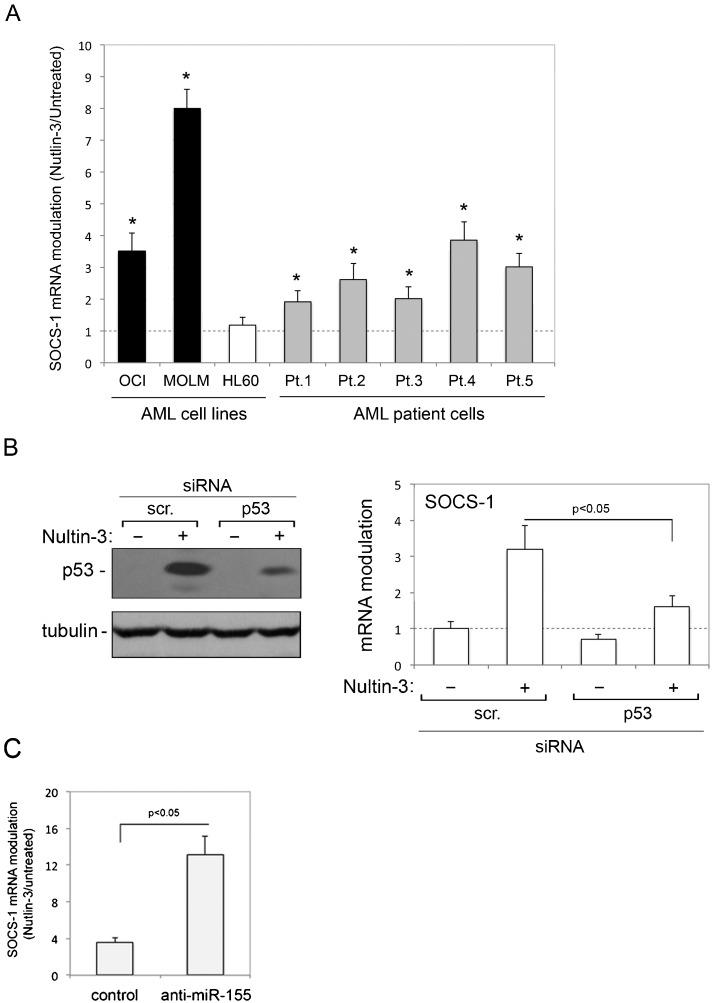
Figure 1.
Transcriptional upregulation of SOCS-1 by Nutlin-3 in AML cells. In A, AML cell lines and primary AML patient (Pt.) cells were exposed to Nutlin-3 (10 μM). Levels of SOCS-1 mRNA were analyzed by quantitative RT-PCR. The results are expressed as the fold of increase in SOCS-1 modulation by Nutlin-3 after 24 hours of treatment with respect to the control untreated cultures (set to 1) (hatched line). Data are reported as the mean±SD of the results from at least three experiments, each performed in triplicate. In B, OCI cells were transfected with control scrambled (scr.) siRNA or p53 siRNA before treatment with Nutlin-3. p53 protein levels were analyzed by Western blot, and tubulin staining is shown as the loading control. Representative examples of Western blot results, from three independent experiments are shown. In parallel, levels of SOCS-1 mRNA were expressed as the fold increase with respect to the scrambled control transfected cultures. In C, OCI cells transfected with either hsa-miR-155 anti-miR oligo or miR negative control oligo were exposed to Nutlin-3 and SOCS-1 mRNA was expressed as the fold increase in modulation. Asterisks, p<0.05 with respect to the untreated cultures or to the scrambled control transfected cultures.

