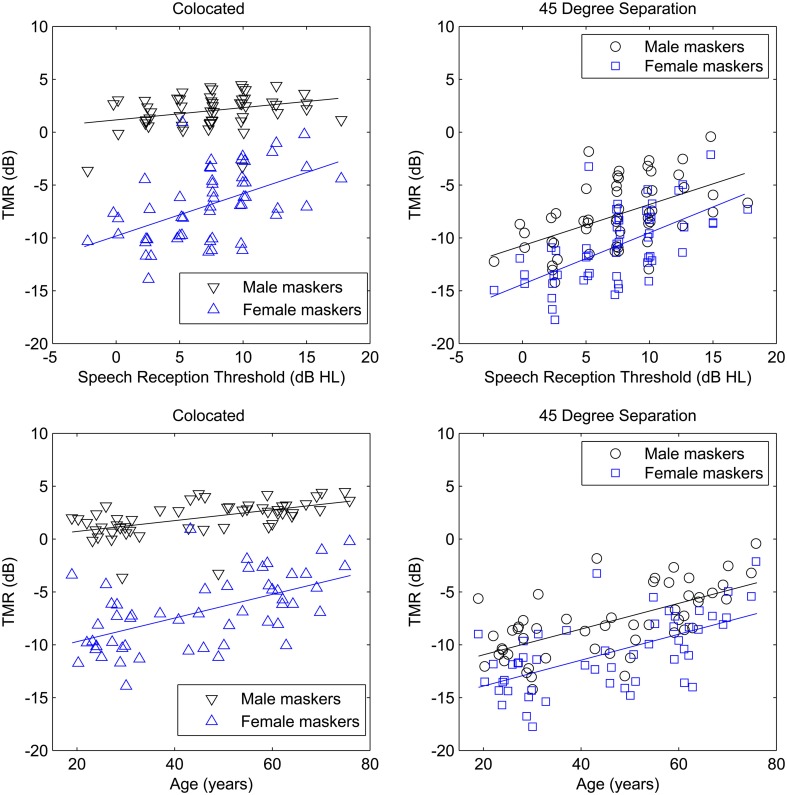
Figure 4.
TMR as a function of speech reception threshold (SRT; top panels) and age (bottom panels) for the participants in Experiment Two. Thresholds for male and female maskers are plotted separately for colocated targets (left panels) and spatially separated targets (right panels). SRT values are offset slightly to improve visualization.

