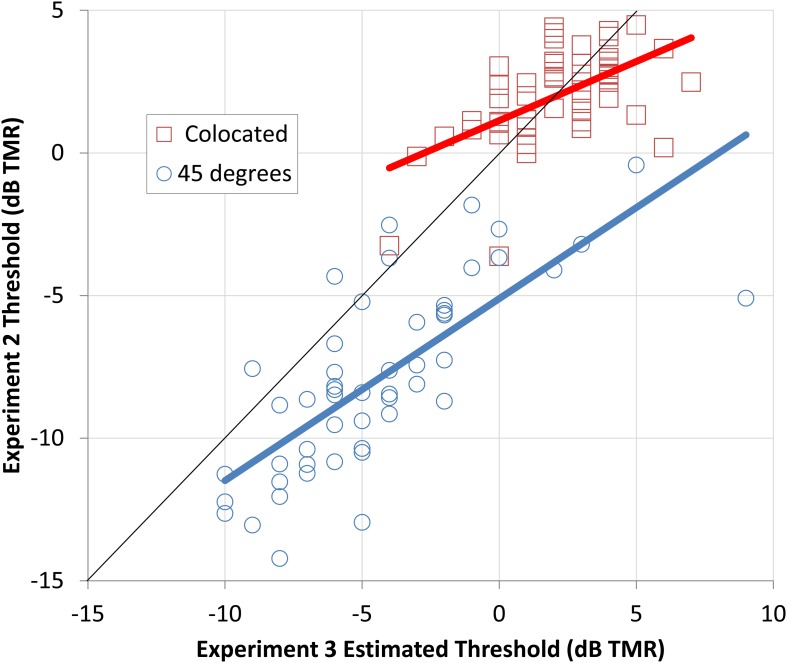
Figure 6.
The thresholds obtained in Experiment Two (y axis) for the male target and male maskers are plotted relative to the thresholds estimated from the progressive tracks used in Experiment Three (x axis). The squares indicate the thresholds for the colocated conditions and the circles indicate the spatially separated condition. Best-fitting linear predictors are shown as thick red (colocated) and blue (spatially separated) lines.

