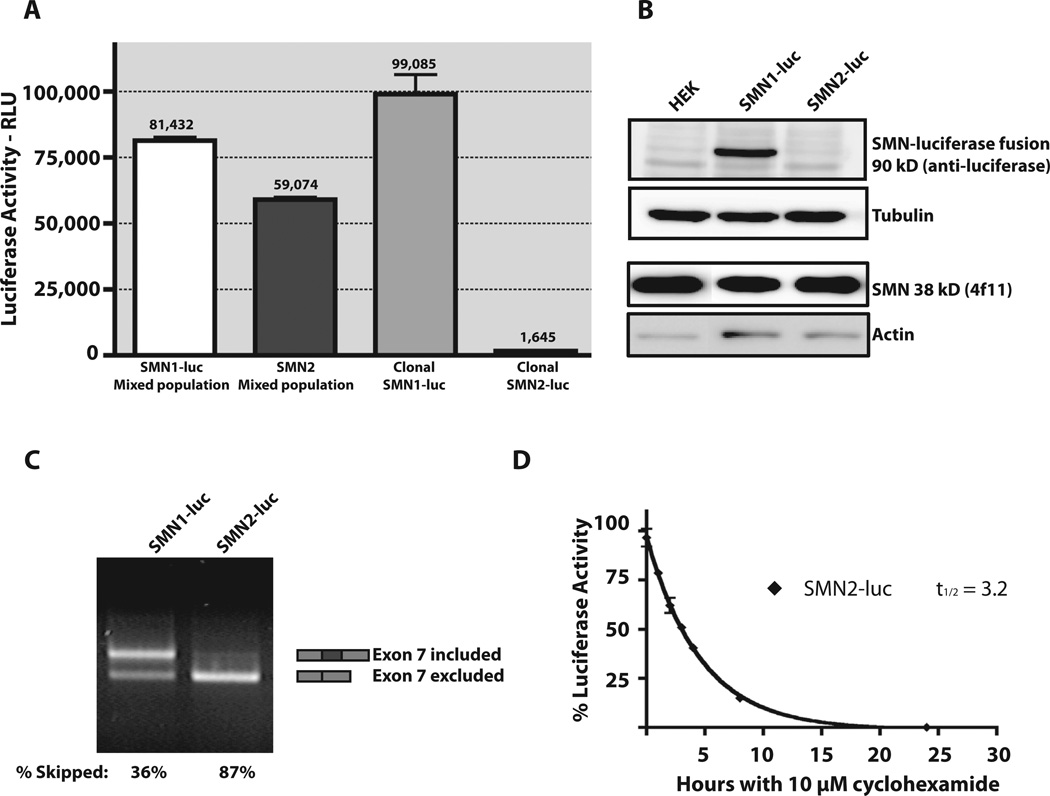
Figure 2.
Reporter assay validation. (A) Comparison of luciferase activity for equivalent numbers of mixed population SMN1-luc, mixed population SMN2-luc, clonal SMN1-luc, and clonal SMN2-luc cells. Luciferase activity, scored as relative light units (RLU). (B) Detection of SMN-luciferase fusion protein in HEK parent, SMN1-luc, and SMN2-luc reporter cells. Lysates were blotted for the fusion protein with an anti-luciferase antibody and endogenous SMN and compared with actin and tubulin. (C) End point RT-PCR was used to compare mRNA species of SMN1-luc and SMN2-luc cells. Primer pairs were designed to amplify both full-length and exon 7–excluded SMN-luciferase mRNA. Percentage inclusion was determined by comparing band intensities using Quantity One software. (D) SMN-luciferase fusion stability was determined by treating cells with 10 µM cycloheximide and measuring luciferase activity at various time points. Data were plotted using Prism4 (GraphPad Software Inc.), and nonlinear regression was used to determine protein half-life.

