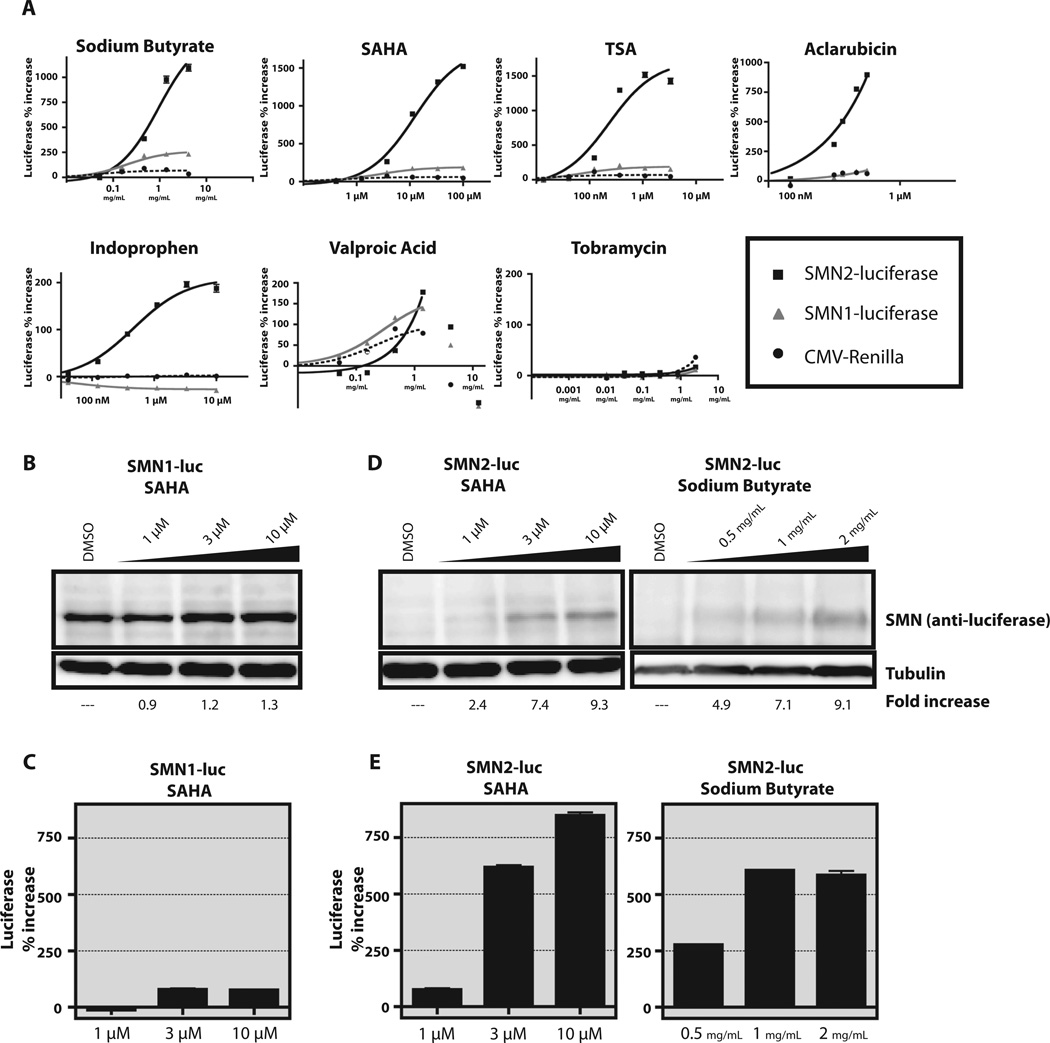
Figure 3.
Activity of known compounds in the reporter cells. (A) Sodium butyrate, SAHA, TSA, aclarubicin, indoprofen, valproic acid, and tobramycin were tested in six-point dose-response experiments. Each compound was tested at concentrations previously reported to increase SMN protein levels. Black square with solid line, SMN2-luc cells; gray triangle, SMN1-luc cells; black circle with dotted line, SV40 control. Y-axis represents percentage activation relative to DMSO control. All points were tested in quadruplicate and plotted as mean ± SEM. Curves were created by linear regression using Prism4 (GraphPad Software Inc.). (B, C) SMN1-luc cells were treated for 24 h at increasing concentrations of SAHA. The amount of SMN-luciferase fusion protein detected by anti-luciferase antibody (B) is similar to the percentage increase in luciferase activity in the same samples (C). (D, E) SMN2-luc cells were treated for 24 h with increasing amounts of SAHA or sodium butyrate. The increase in SMN-luciferase fusion protein (D) correlates with luciferase activity (E). Experiments were performed three times with similar results. Blots shown are representative.

