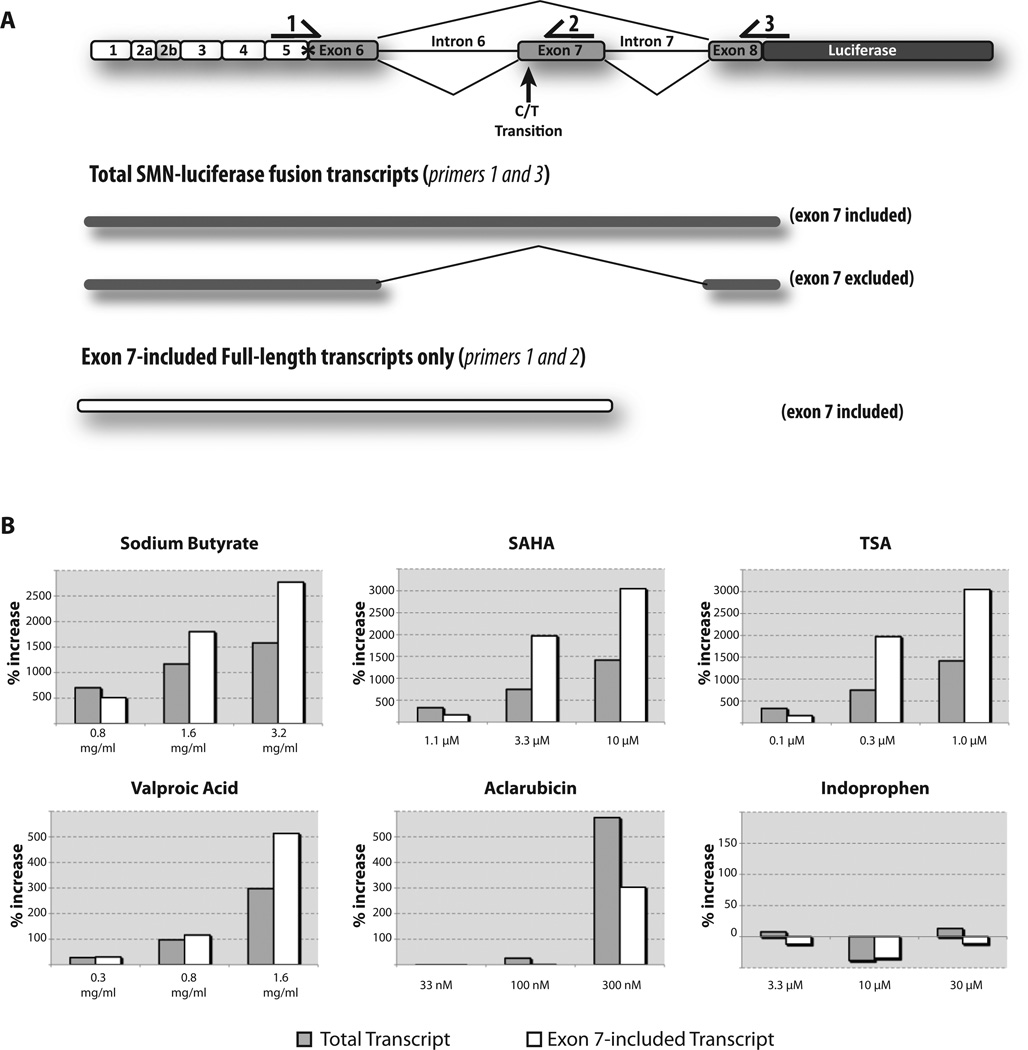
Figure 4.
Analysis of SMN-luciferase fusion transcripts by qRT-PCR. (A) A schematic of the primer design for qRT-PCR. Primer pairs were chosen to amplify only the SMN-luciferase fusion transcripts but not endogenous SMN. Primer 1 overlaps a unique Xho I site (*). Primers 1 and 2 can amplify only full-length SMN-luc transcripts that contain exon 7. Primers 1 and 3 amplify SMN-luc reporter transcripts (both exon 7 included and excluded). (B) Comparison of increases in amount of total reporter transcripts (gray bars) and amount of exon 7–included reporter transcripts (white bars). Cells were treated at increasing concentrations of compound for 24 h. Percentage increase was calculated in relation to treatment with DMSO and normalized to GAPDH.

