Fig. 1.


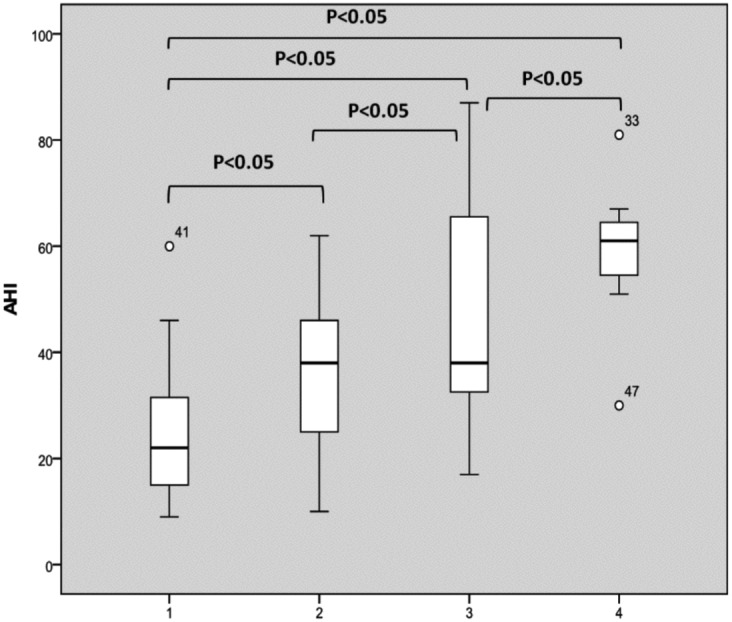
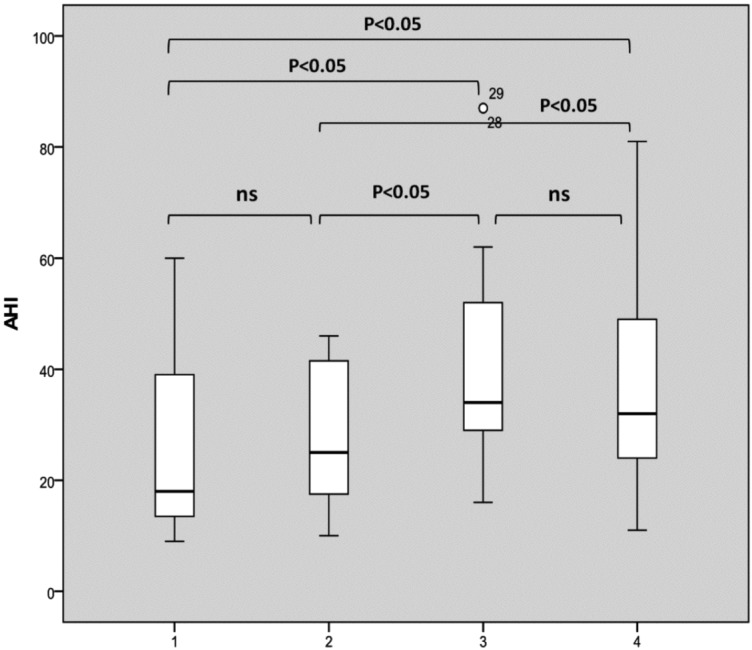
AHI distribution based on the number of sites of complete collapse (a) and complete plus partial collapses greater than 50% (b). The box plots show the median and inter-quartile range and the error bars show the 5th and 95th percentiles.
a. 1: one complete site of obstruction of 100%; 2: two complete sites of obstruction of 100%; 3: three complete sites of obstruction of 100%; 4: four complete sites of obstruction of 100%).
b. 1: one site of obstruction of 100% or > 50%; 2: two sites of obstruction of 100% and/or > 50%; 3: three sites of obstruction of 100% and/or > 50%; 4: four sites of obstruction of 100% and/or > 50%).
