
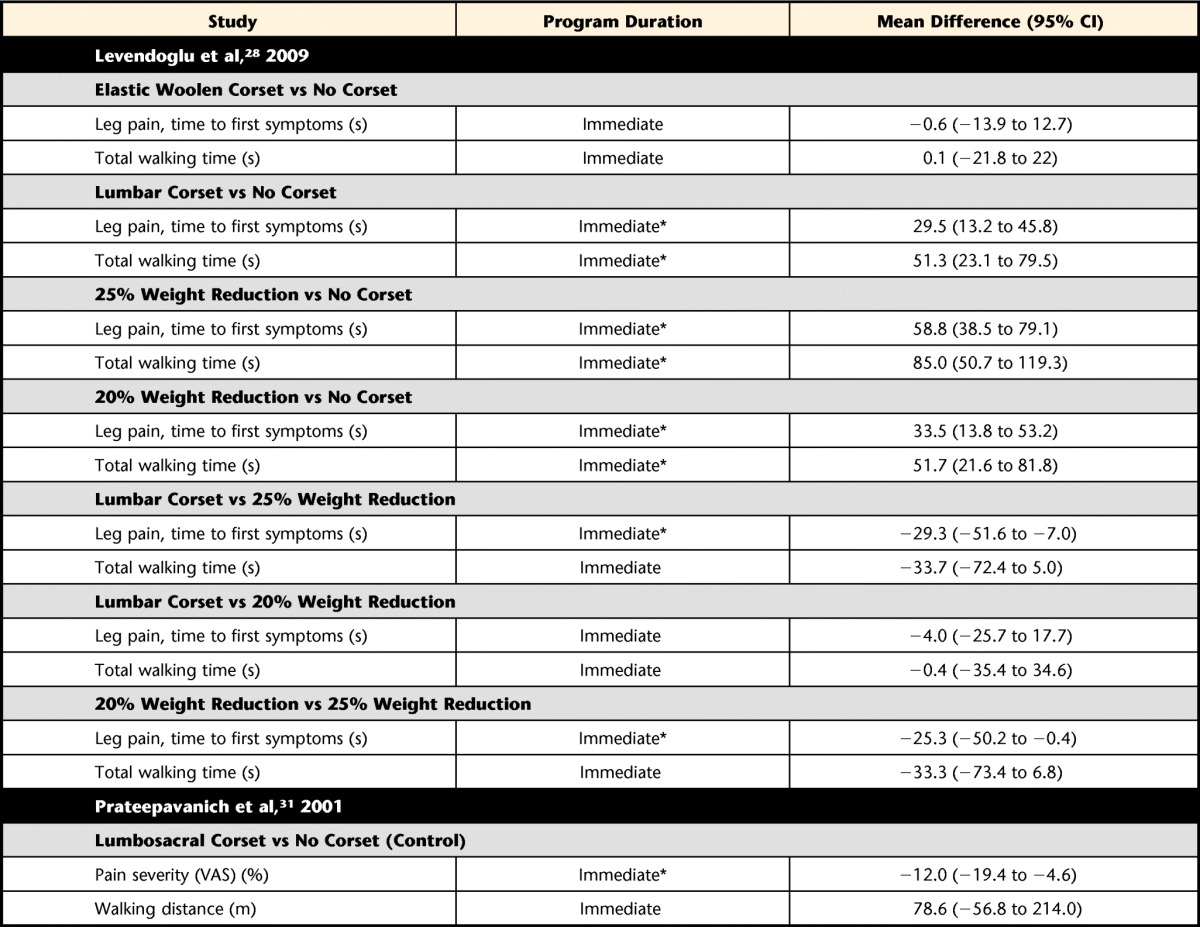
Table 5.
Results of Individual Studies That Were Not Pooled, With Outcomes Presented as Mean Difference and 95% Confidence Interval (95% CI) Comparing Different Types of Corsetsa
a
For all comparisons, effect estimates represent the group receiving the first therapy listed minus the group receiving the second therapy listed. Therefore, positive effect estimates indicate a lower mean score for the first therapy listed, whereas negative values indicate a lower score for the second therapy listed. VAS=visual analog scale. *P<.05.