
Figure 4.
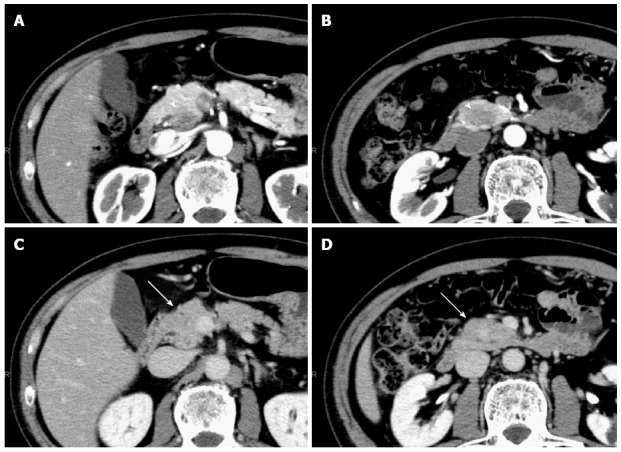
Computer tomography scan. A, B: Both cystic lesions (arrow-head) showed a lower density than the surrounding pancreatic parenchyma during the pancreatic parenchymal phase; C, D: Both cystic lesions (arrow) appeared as iso-dense in the equilibrium phases.