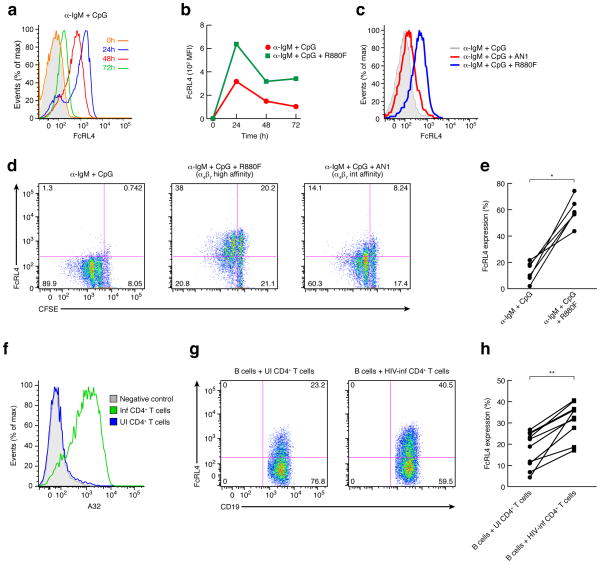
Figure 6.
FcRL4 expression induced by α-IgM + CpG stimulation is increased and prolonged in presence of an α4β7-reactive gp120. (a) FACS analysis of FcRL4 expression over a time course of 0–72h on freshly isolated B cells stimulated with α-IgM + CpG. Isotype control in shown as a grey shade. (b) FACS analysis of FcRL4 expression over time (0–72h) on freshly isolated B cells stimulated with α-IgM + CpG +/− an α4β7-reactive gp120. (c) FACS analysis of FcRL4 expression at 72h on freshly isolated B cells stimulated with α-IgM + CpG in presence or absence of gp120 with a high (R880F) and an intermediate (AN1) affinity for α4β7. (d) In vitro proliferation assays (CFSE) were performed with B cells that were stimulated with α-IgM + CpG for 96h and analyzed by FACS after staining for FcRL4 surface expression. CFSE staining by FcRL4 is presented and is representative of five independent experiments. (e) % FcRL4 expression on B cells stimulated with α-IgM + CpG +/− α4β7-reactive gp120 from 6 independent donors p=0.03 (Wilcoxon matched-pairs signed rank test) (n=6). (f) Histogram of a FACS analysis of an A32 (anti-gp120) staining of HIV-1 infected or uninfected CD4+ T cells that were employed in the co-culture experiment. (g) FACS analysis of FcRL4 expression on B cells co-cultured with infected CD4+ T cells isolated from the same donor. Shown is a representative result from one of ten independent donors of the surface expression of FcRL4 by CD19 detected by FACS after 48h of co-culture. (h) % FcRL4 expression on B cells from 10 donors stimulated with α-IgM + CpG and co-cultured with autologous uninfected or HIV-1 infected donor CD4+ T cells, p=0.002 (Wilcoxon matched-pairs signed rank test) (n=10).

