Fig. 5.
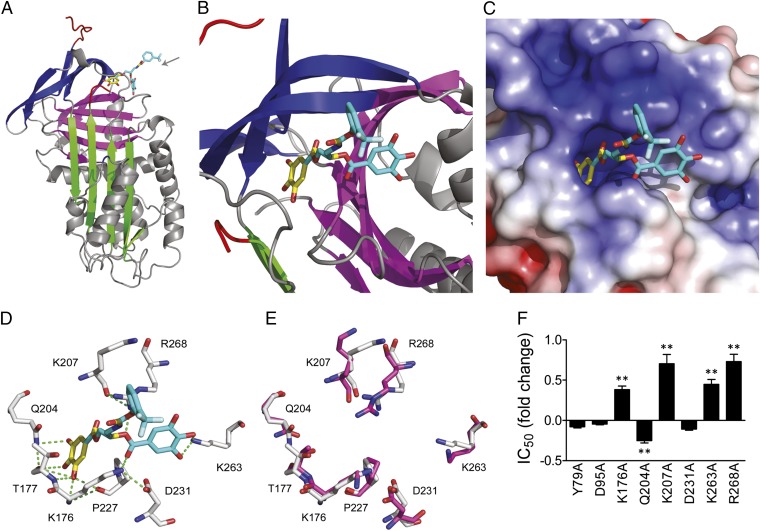
CDE-096 binds to a unique inhibitory site in PAI-1. (A and B) Diagrammatic representation of the 3D structure of the high-affinity PAI-1/CDE-096 complex. The protein is shown in ribbon style, with sheet A in green, sheet B in purple, sheet C in blue, and the RCL in red. The resolved portion of the compound is represented by the yellow sticks, whereas the remainder of the compound is approximated using mutational and biochemical data and is shown in cyan. The gray arrow designates the direction from which the binding site is viewed in B. (C) Electrostatic surface rendering of PAI-1 at the CDE-096 binding site (more positively charged regions in blue, and more negatively charged regions in red). (D) Residues predicted to hydrogen bond with CDE-096. PAI-1 residues are shown in white, CDE-096 in yellow, and cyan with oxygen atoms in red and nitrogen atoms in blue, and predicted hydrogen bonds as green dashes. (E) Overlay of the putative high-affinity binding site as predicted in D with the same residues in latent PAI-1, with residues from native PAI-1 shown in white, and those from latent PAI-1 shown in purple. (F) Inhibitory activity analysis of the alanine substitutions of residues in WT PAI-1 from two candidate binding sites. The IC50 of inhibition of each mutant by CDE-096 is shown relative to that of WT PAI-1. Mutants that showed significant differences in their IC50s compared with WT PAI-1 as determined by a two-tailed Student t test are indicated (**P < 0.01).

