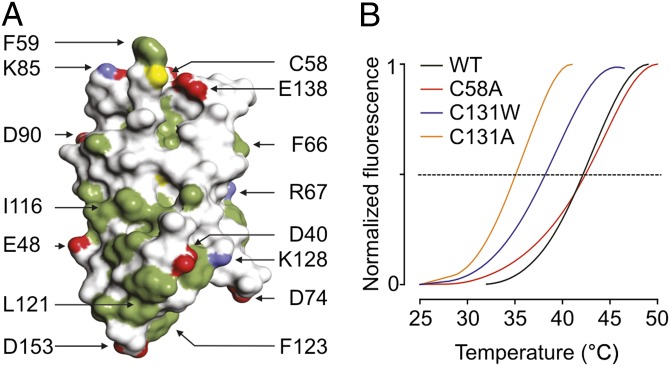
Fig. 3.
Surface representation and thermal stability of the β4 extracellular domain. (A) Surface representation of the β4 extracellular domain. Hydrophobic side chains are indicated in green, carboxyl groups of Asp and Glu are shown in red, and the positively charged nitrogen groups of Lys and Arg are in blue. The position of 58Cys is shown in yellow; other select residues are labeled for reference purposes. (B) ThermoFluor experiments showing average melting curves for WT β4 and three mutants under reducing conditions (14 mM 2-ME). The melting temperatures are WT: 42.2 ± 0.1 °C; C58A: 42.2 ± 0.2 °C; C131W: 38.3 ± 1.1 °C; and C131A: 35.1 ± 0.4 °C (SDs are the results of three measurements). The melting curves for C131W and C131A are identical in the absence or presence of 2-ME.

