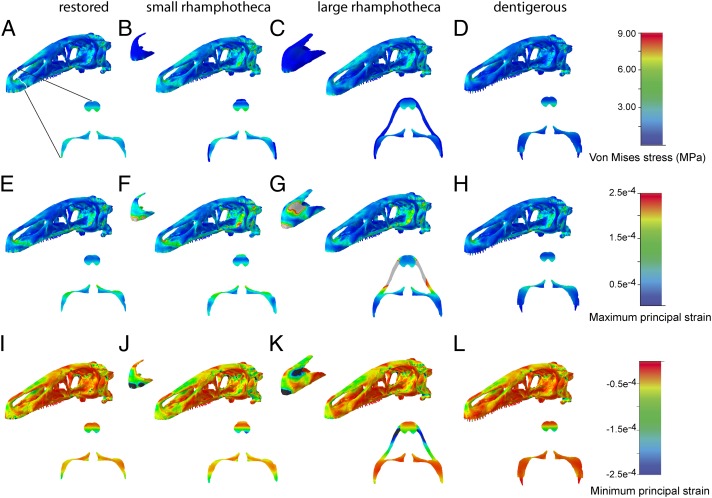
Fig. 3.
Comparison of (A–D) Von Mises stress, (E–H) maximum principal strain, and (I–L) minimum principal strain distribution in the different skull configurations of E. andrewsi and coronal cross-sections through the premaxillary region. All models simulate a bite at the tip of the beak. Contour plots are scaled to (A–D) 9-MPa peak stress, (E–H) 0.00025 peak strain, and (I–L) −0.00025 peak strain.

