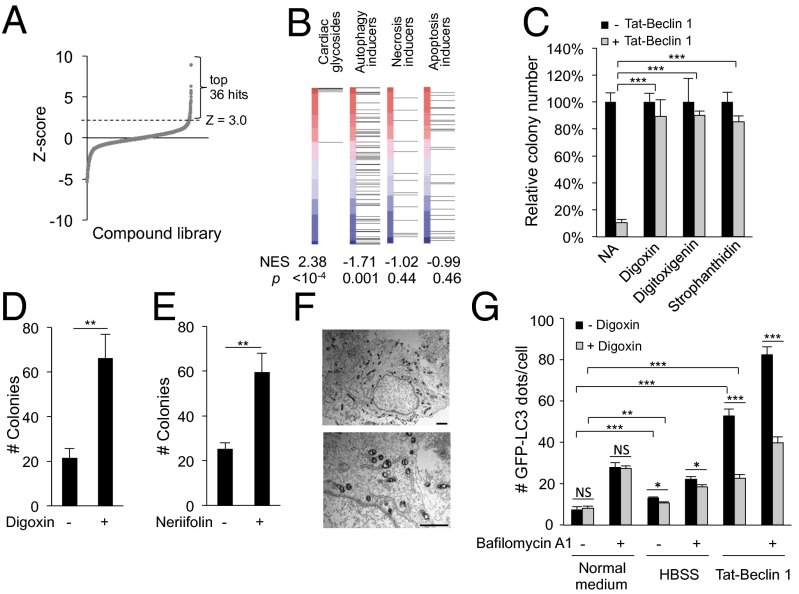
Fig. 6.
Cardiac glycosides rescue autosis. (A) Ranked distribution of z scores for each compound in primary chemical screen (Dataset S1) for inhibitors of Tat-Beclin 1-induced cell death. Thirty-six top hits with z ≥ 3.0 (Dataset S2) were selected for a secondary screen (Dataset S3). (B) Comparison of CSEA of cardiac glycosides in the primary autosis screening with compound sets of specific autophagy, necrosis, or apoptosis inducers. P, permutation P value for the NES compared with a null distribution. Red–blue vertical bars represent list of screened compounds, ranked according to z score (greatest rescue of autosis at top). Each horizontal line indicates where a specific compound falls within ranked compound list. (C) Clonogenic survival of HeLa cells treated with Tat-Beclin 1 (20 µM, 5 h) + 5 µM digoxin, digitoxigenin, or strophanthidin. The number of colonies of untreated cells was standardized as 100%. (D and E) Clonogenic survival of adherent HeLa cells starved for 48 h ± 10 nM digoxin (D) or 1 nM neriifolin (E). (Nanomolar concentrations were used as toxicity of digoxin and neriifolin was observed during starvation with micromolar concentrations.) (F) Representative EM images of a HeLa cell treated with 20 µM Tat-Beclin 1 + 5 µM digoxin (5 h). (Scale bar, 1 µm.) (G) Quantitation of GFP-LC3 dots (>100 cells analyzed per sample) in HeLa/GFP-LC3 cells treated with 20 µM Tat-Beclin 1 or starved in HBSS for 2 h ± 0.1 µM digoxin and/or 20 nM bafilomycin A1. For C–E and G, error bars represent mean ± SEM of triplicate samples and similar results were observed in three independent experiments. NS, not significant; *P < 0.05; **P < 0.01; ***P < 0.001; t test. See also Figs. S5 and S6 and Datasets S1–S4.

