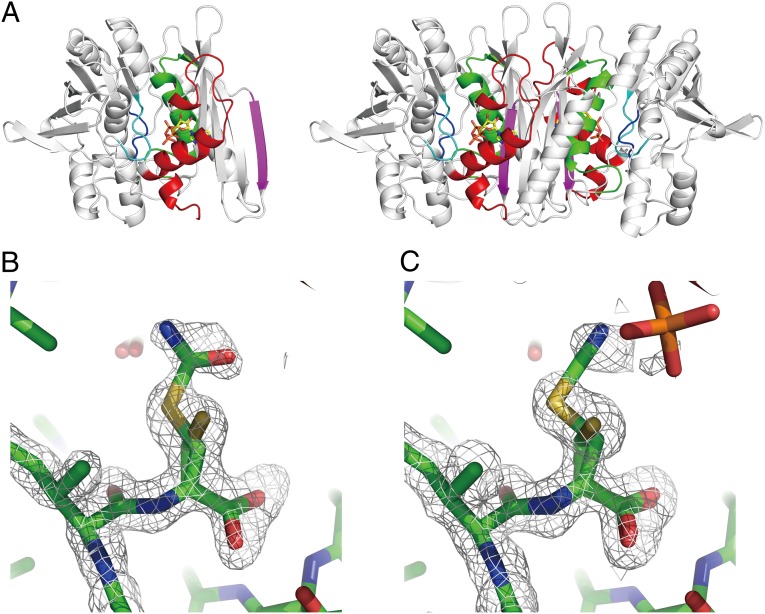
Fig. 1.
Structures of the carbamoylated and cyanated forms of HypE. (A) Overall structure of the TkHypE monomer (Left) and dimer (Right). ATP is shown in a stick model. The N-terminal lobe and the conserved motifs I, II, III, and IV are shown in red, green, magenta, cyan, and orange, respectively. (B and C). Close-up views of the carbamoylated cysteine (B) and cyanated cysteine (C). The electron density of an Fo–Fc omit map around residues 335–338 is shown at 3.0 σ in a gray mesh.

