
Fig. 3.
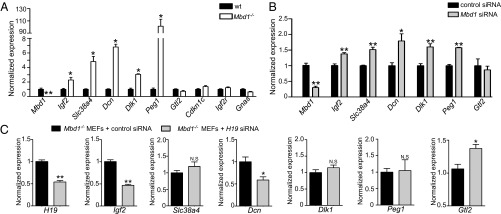
H19 represses its targets via the MBD1 protein. (A) Expression levels of the IGN in Mbd1−/− samples were detected by RT-qPCR. The expression level in WT MEFs was set at 1, and histograms show modifications relative to this level (n = 4). (B) siRNA-mediated knockdown experiments of MBD1 in WT MEFs. The expression level in MEFs treated with a nonsilencing control was set at 1, and histograms show modifications relative to this level (n = 6). (C) siRNA-mediated knockdown experiments of H19 in Mbd1−/− MEFs. The expression level in MEFs treated with a nonsilencing control was set at 1, and histograms show modifications relative to this level (n = 6).