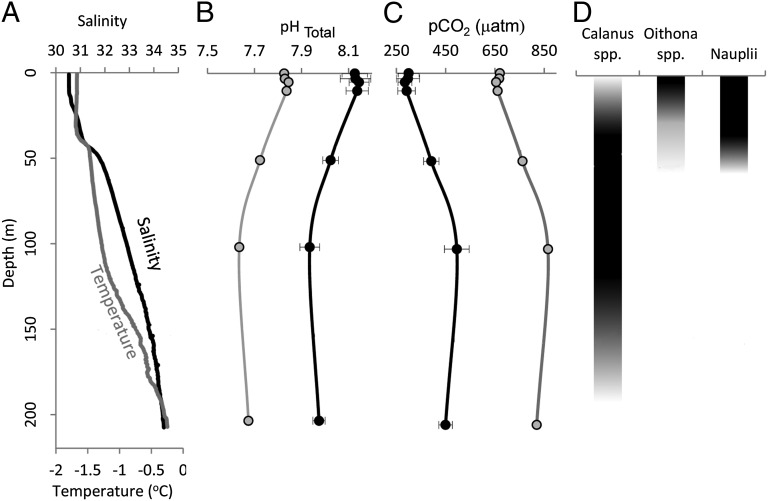
Fig. 3.
Temperature (°C) and salinity profiles through the water column at the CIB (A); water column profile of pH from the 2011 data (mean ± SD; black circles) calculated from DIC and alkalinity and the projected pH for year 2100 (gray circles), assuming a 0.4-unit decrease across the 200-m water column (B); water column profile of pCO2 from the 2011 data (mean ± SD; black circles) calculated from DIC and alkalinity and the projected pCO2 for year 2100 (gray circles), assuming a doubling of atmospheric CO2 (C); and illustration of the depth of vertical migration of copepod species observed at the CIB and investigated in the OA experiments (D).

