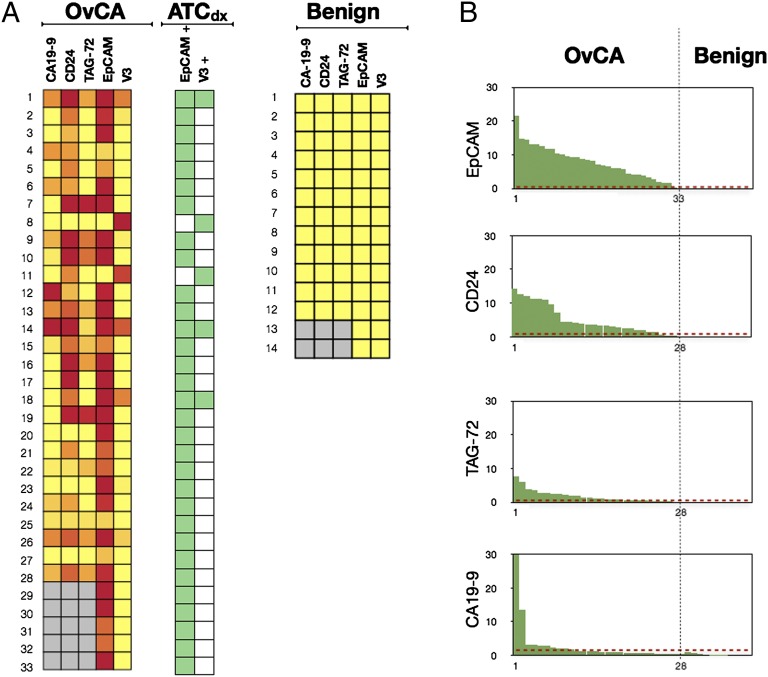
Fig. 3.
Prospective testing of ATC marker panels in 47 patients. (A) Ascites samples were tested for the presence of six individual markers in 33 ovarian-cancer patients (Left) and 14 controls (right). EpCAM alone was positive in 31 samples. By using the V3 marker set (Vimentin+/Calretinin−/CD45−) and EpCAM together (ATCdx), all 33 samples were correctly identified (green heat map). ATCs were identified in malignant samples, but not in benign samples. Gray squares represent data not measured due to insufficient number of cells for flow cytometry. Color scale is same as Fig. 2B. (B) Waterfall plots of the individual markers profiled in the test set. Dotted red lines represent the optimal threshold values determined from ROC analyses performed on the training set (SI Appendix, Fig. S4).

