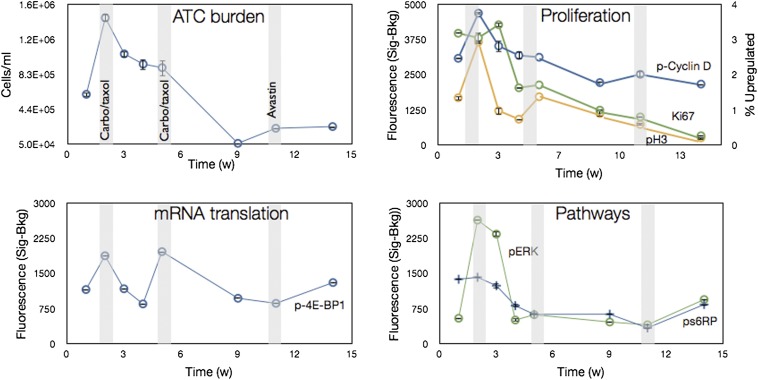
Fig. 7.
Serial analysis of ATCs. ATCs were obtained serially from a single patient over a 14-wk treatment cycle. Carboplatin and Paclitaxel (Taxol) were given in weeks 2 and 5, and Bevazucimab (Avastin) was given in week 11. The number of ATCs was measured over the course of treatment (ATC burden) using ATCdx. Additionally, protein markers related to biological processes such as proliferation (Ki67, pH3, pCyclinD), mRNA translation (p4E-BP1), and pathway inhibition (pS6RP, pERK) were also measured. The broader analyses demonstrate molecular profiling of ascites can be used as a tool to monitor treatment response over the course of therapy. All samples were stained with calretinin and CD45 antibodies to exclude mesothelial cells and and leukocytes, respectively. Data are expressed as the average of the mean fluorescent intensity subtracted from background ± SEM. pH3 data are plotted as % of cells up-regulated.

