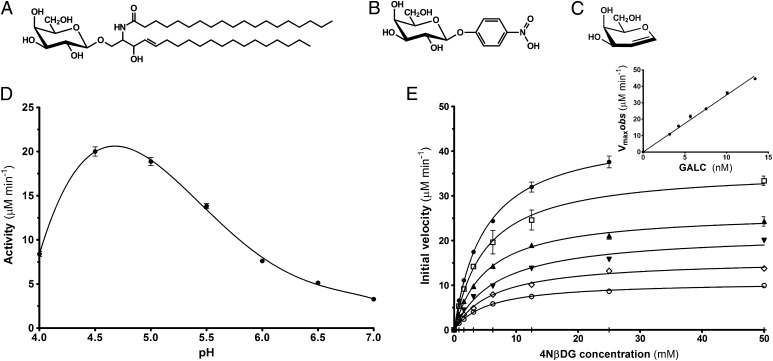
Fig. 1.
Enzyme kinetic analysis of GALC. (A–C) Schematic diagram of the natural substrate β-d-galactocerebroside (A), the chromogenic substrate 4NβDG (B), and the inhibitor d-galactal (C). (D) pH profile of enzyme activity for GALC. SEM error bars are shown. (E) Michaelis–Menten plots of initial velocity vs. substrate concentration at GALC concentrations of 3.18 nM (○), 4.24 nM, (◇), 5.66 nM, (▼), 7.54 nM, (▲), 10.1 nM, (□), and 13.4 nM (●). (Inset) Plot of Vmaxobs vs. GALC concentration showing kcat (57.8 s−1) as the gradient. SEM error bars are shown.

