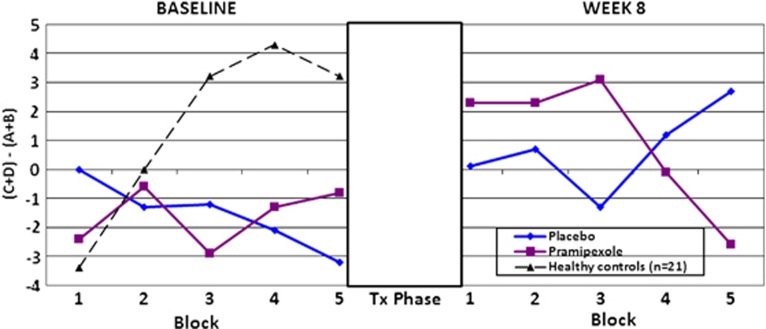
Figure 1.
The Iowa Gambling Task (IGT) results by group pre- and post-treatment. Performance across five blocks on the IGT. The x-axis represents the five blocks of the task, with the left panel marking the performance at baseline and the right panel marking the performance at week 8. A gray-scale rectangle depicts the 8-week treatment trial, during which time no testing was conducted. The y-axis shows the NET score variable, which is calculated by subtracting the total number of cards chosen from the disadvantageous decks from the total number of cards chosen from the advantageous decks.

