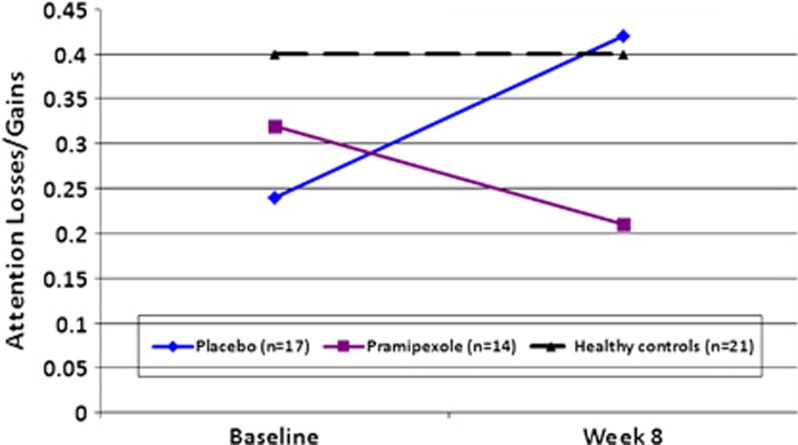
Figure 2.
Choice strategy: Attention to Losses vs Gains. The card-by-card selection strategy employed with scores from the Attention Losses/Gains index of the expectancy valence model. The x-axis is labeled for the two time points (baseline and week 8), with the y-axis representing the ratio of attention given to negative feedback information (losses) relative to positive feedback (wins). Higher scores represent more attention to losses than to gains.

